The SEO metrics to report to clients every month, and the ones to drop
The six SEO metrics a client should see each month, how to read them, the five to drop, and how to build the monthly report from Search Console and GA4.

Report six things to an SEO client every month: organic key events, organic engaged sessions, Search Console clicks, non-brand clicks, the pages ranking 4 to 20 with the most impressions, and the work you'll do next. Drop third-party authority scores, total keyword counts and site-wide average position on its own. They move for reasons that have nothing to do with the client's business.
This guide explains each metric, where it comes from and how to read it, then shows how to build the monthly report in Datapipe from the Search Console and GA4 report templates. It ends with three prompts you can copy into Claude or ChatGPT to write the month's summary from live numbers.
The six metrics, in the order the client reads them
Start with what the client pays for, then show how search delivered it, then show what you'll do about it. Each metric answers one question.
| Metric | Question it answers | Source | Where it lives in Datapipe |
|---|---|---|---|
| Organic key events | Did search bring signups, leads or sales? | GA4, Session default channel group = Organic Search | GA4 report template, Acquisition page |
| Organic engaged sessions | Did the visitors from search stay and read? | GA4 | GA4 report template, Acquisition page |
| Clicks | How many people came from Google? | Search Console | Search Console report template, Overview page |
| Non-brand clicks | Are new people finding the client, or only people who already know the name? | Search Console, split by query | Search Console report template, Queries page, with one calculated field |
| Pages ranking 4 to 20 with the most impressions | Where is the next win? | Search Console | SEO report template, Review priorities page |
| Work done and next month's plan | What did you do, and what changes now? | You | A text box on the first page |
Impressions, click-through rate (CTR) and average position still belong in the report, because they explain the clicks number, so put them next to it rather than at the top where a client reads them as the result.
How to read each metric
Each metric has one trap. Here's how to avoid it.
Organic key events
Key events are the GA4 events marked as important, such as a form submission or a purchase. Filter GA4 to the Organic Search channel and count them for the month. If the client hasn't marked any events as key events yet, set that up before the first report. Otherwise you're reporting visits and hoping.
Organic engaged sessions
GA4 counts a session as engaged when it lasts longer than 10 seconds, has a key event, or has at least two page or screen views. Engaged sessions beat raw sessions. A two-second visit counts once in sessions and zero here.
Clicks, impressions, CTR and average position
Google defines CTR as clicks divided by impressions. Average position is the topmost position your site held for each search, averaged across searches, as Google's help page on impressions, position and clicks explains. Two consequences matter for a client report.
First, average position isn't a rank. It describes every search you appeared for, so it gets worse when the site starts appearing for hundreds of new long searches on page 3, even while clicks rise. Second, CTR falls for the same reason. More impressions at low positions dilute the rate. Read both as context for the clicks number, never alone.
Non-brand clicks
Searches that include the client's name click through at many times the rate of everything else. They say little about SEO work. People searching the name would find the site anyway. Split clicks into brand and non-brand, and report the non-brand number as the growth number.
Pages ranking 4 to 20
Pages with lots of impressions at an average position of 4 to 20 are nearly there. They're next month's shortlist. Improve the title, add the missing section, link to the page from related pages. The list turns the report from a scorecard into a plan.
The metrics to drop
Some numbers fill reports because they're easy to pull. Leave these out of the client's headline.
| Metric | Why it misleads | Report instead |
|---|---|---|
| Domain Authority or Domain Rating | A score from an SEO tool's own model, not something Google uses; it can rise while traffic falls | New referring domains to pages you're trying to rank |
| Total keywords ranked | Counts searches on page 5 that nobody clicks; it grows with impressions, not results | Non-brand clicks |
| Site-wide average position on its own | Gets worse when the site appears for new long searches, even as clicks grow | Average position for the pages or queries you're working on |
| Bounce rate | In GA4 it's simply the share of sessions that weren't engaged | Engaged sessions and engagement rate |
| Impressions as the headline | Rises with visibility that brings no visits | Clicks, with impressions beside them |
Here's the stance: if a number can go up while the client's business goes down, it doesn't belong on page one.
Step 1: Add Search Console to a Datapipe project
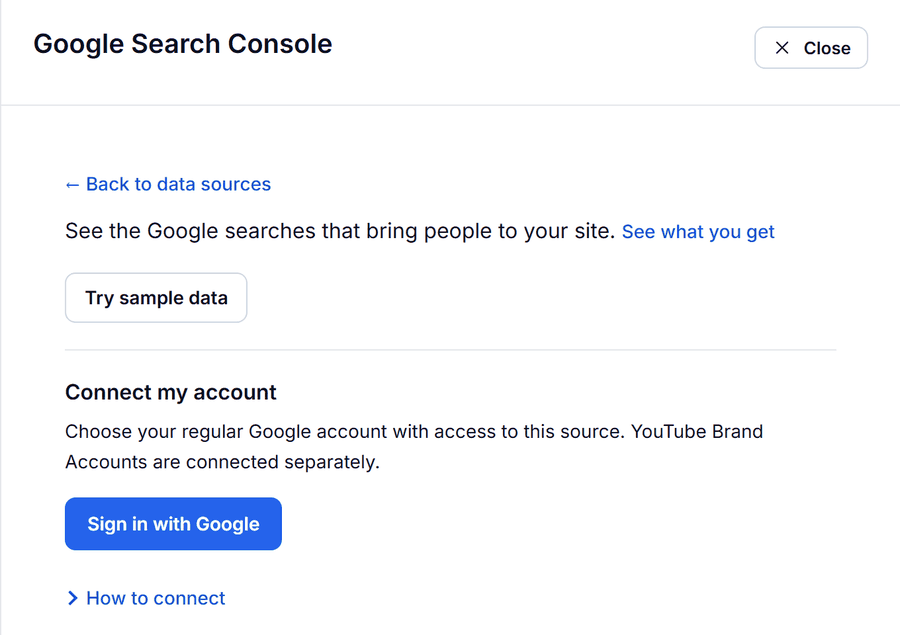
- In Datapipe, open Data sources, choose Add data source and pick the Google Search Console data source.
- Click Sign in with Google with an account that can see the client's property, then choose the property.
Search Console keeps about 16 months of performance data. That's enough for a year-on-year comparison in the very first report.
Step 2: Copy the Search Console report template
- Open Reports, find Google Search Console Report under Data Studio dashboards and click Use template.
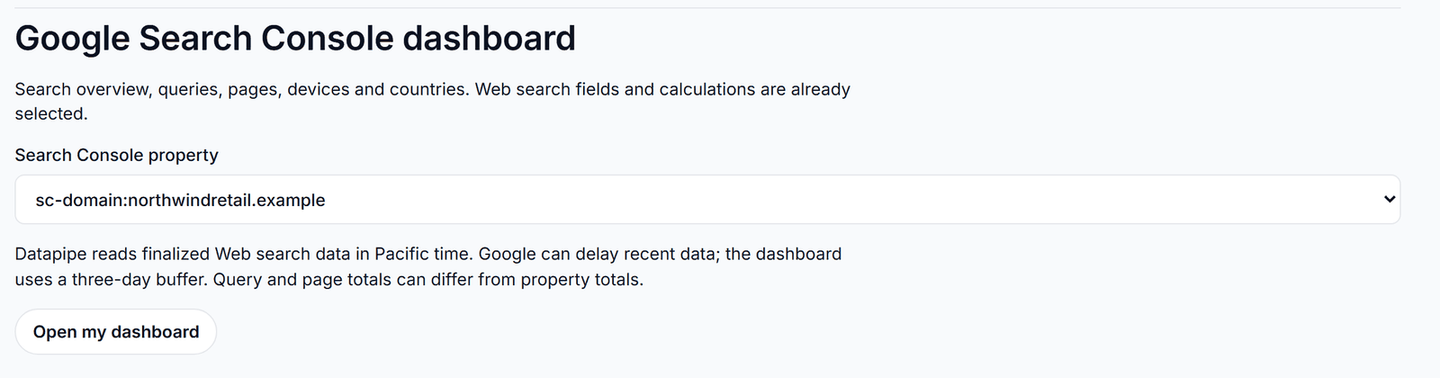
- Choose the property, click Open my dashboard and save your copy in Data Studio.
The Google Search Console report template opens on Overview: clicks, impressions, CTR and average position against the previous 28 days, with daily clicks and impressions. Queries and Pages show the same metrics by search and by page, and Devices and Countries split them further.
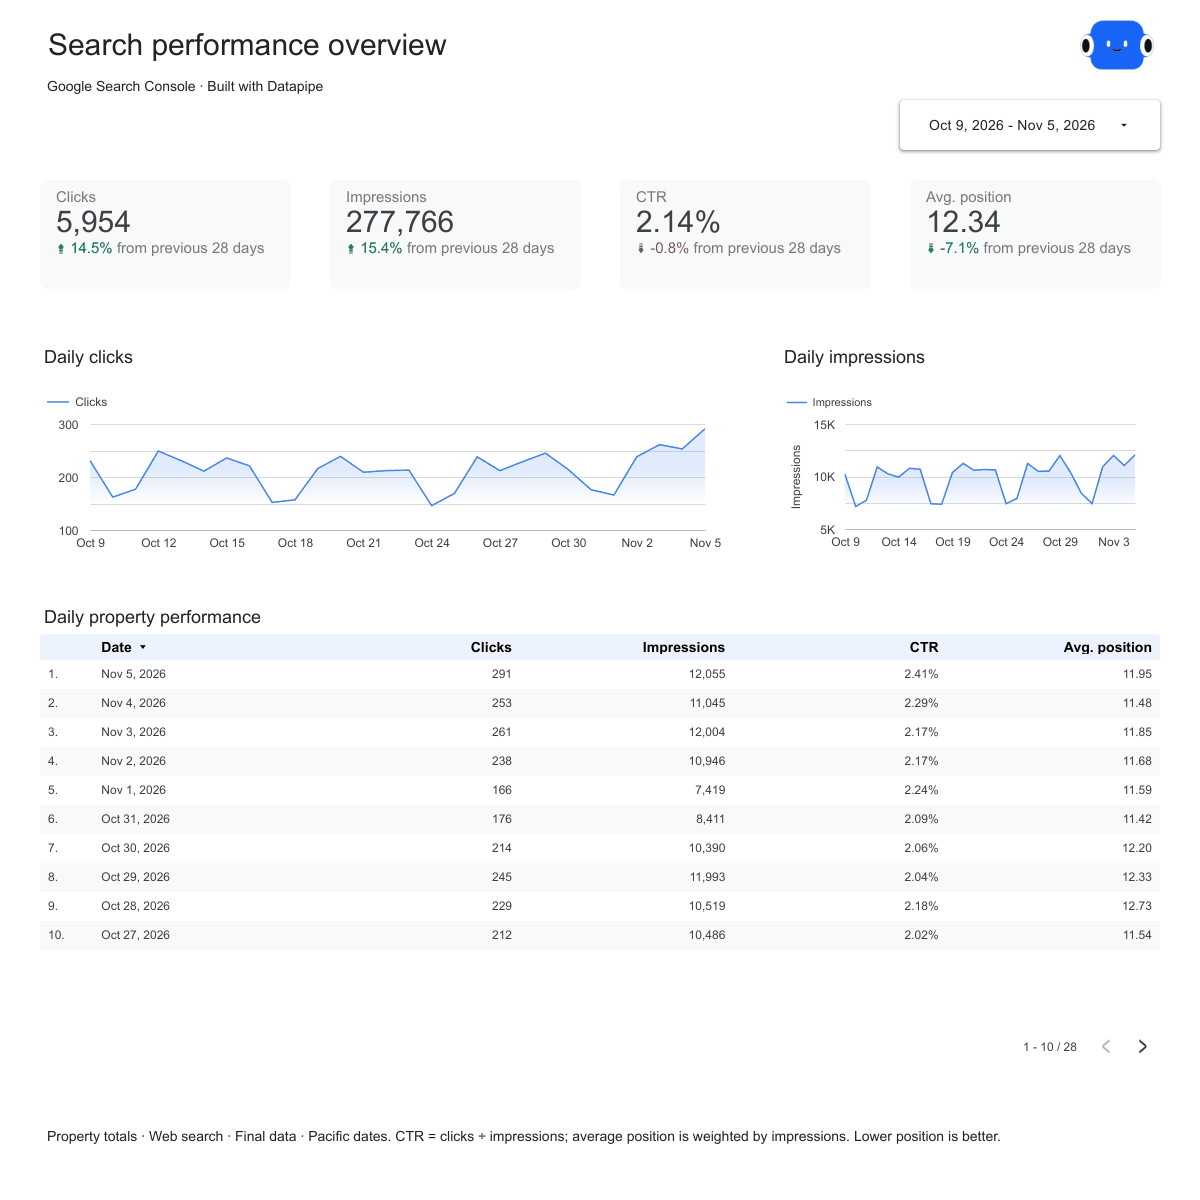
The template opens on the 28 days ending three days before today. Google's data runs behind. Its CTR is total clicks over total impressions, and position is weighted by impressions. For a calendar-month report, change the date range to the previous month.
Step 3: Split brand and non-brand clicks
In your Data Studio copy, open the Queries page, add a calculated field and name it Brand split. Paste this formula, replacing the names with the client's brand terms:
CASE WHEN REGEXP_CONTAINS(Query, "(?i)northstar|north star") THEN "Brand" ELSE "Non-brand" ENDAdd Brand split as a dimension to a scorecard or a small table with Clicks, and you have the two numbers. Include common misspellings and product names in the pattern.
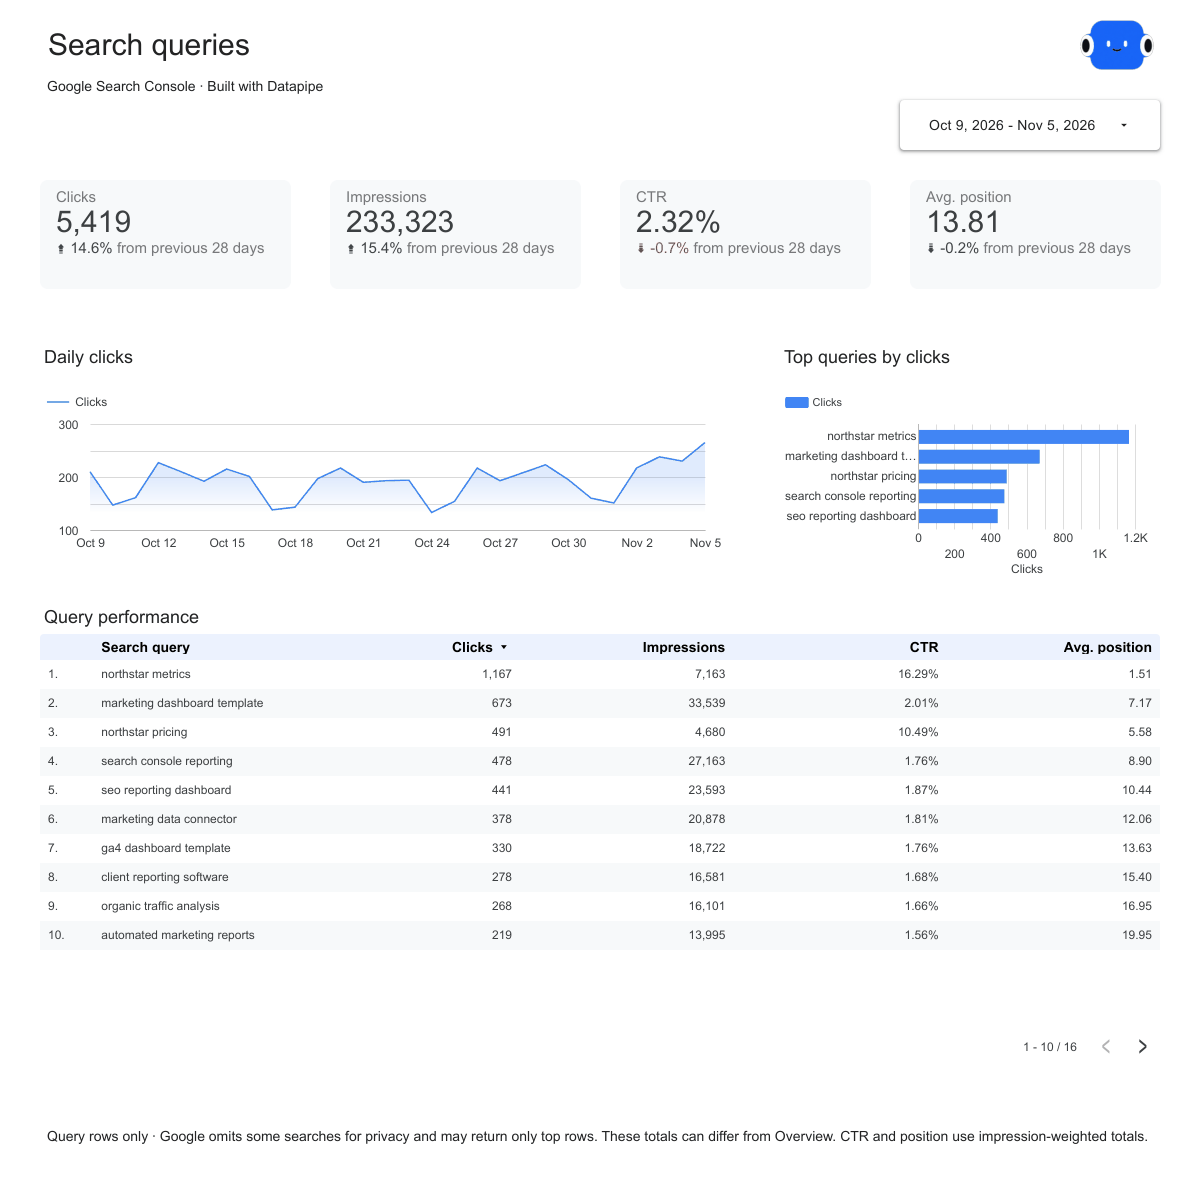
Query rows leave out anonymized searches. So brand plus non-brand clicks add up to less than the property total on Overview. Report the split as a share of query clicks. Say so once.
Step 4: Add the pages to work on next
- In Reports, find SEO Report and click Use template.
- Choose the same property, click Open my dashboard and save your copy.
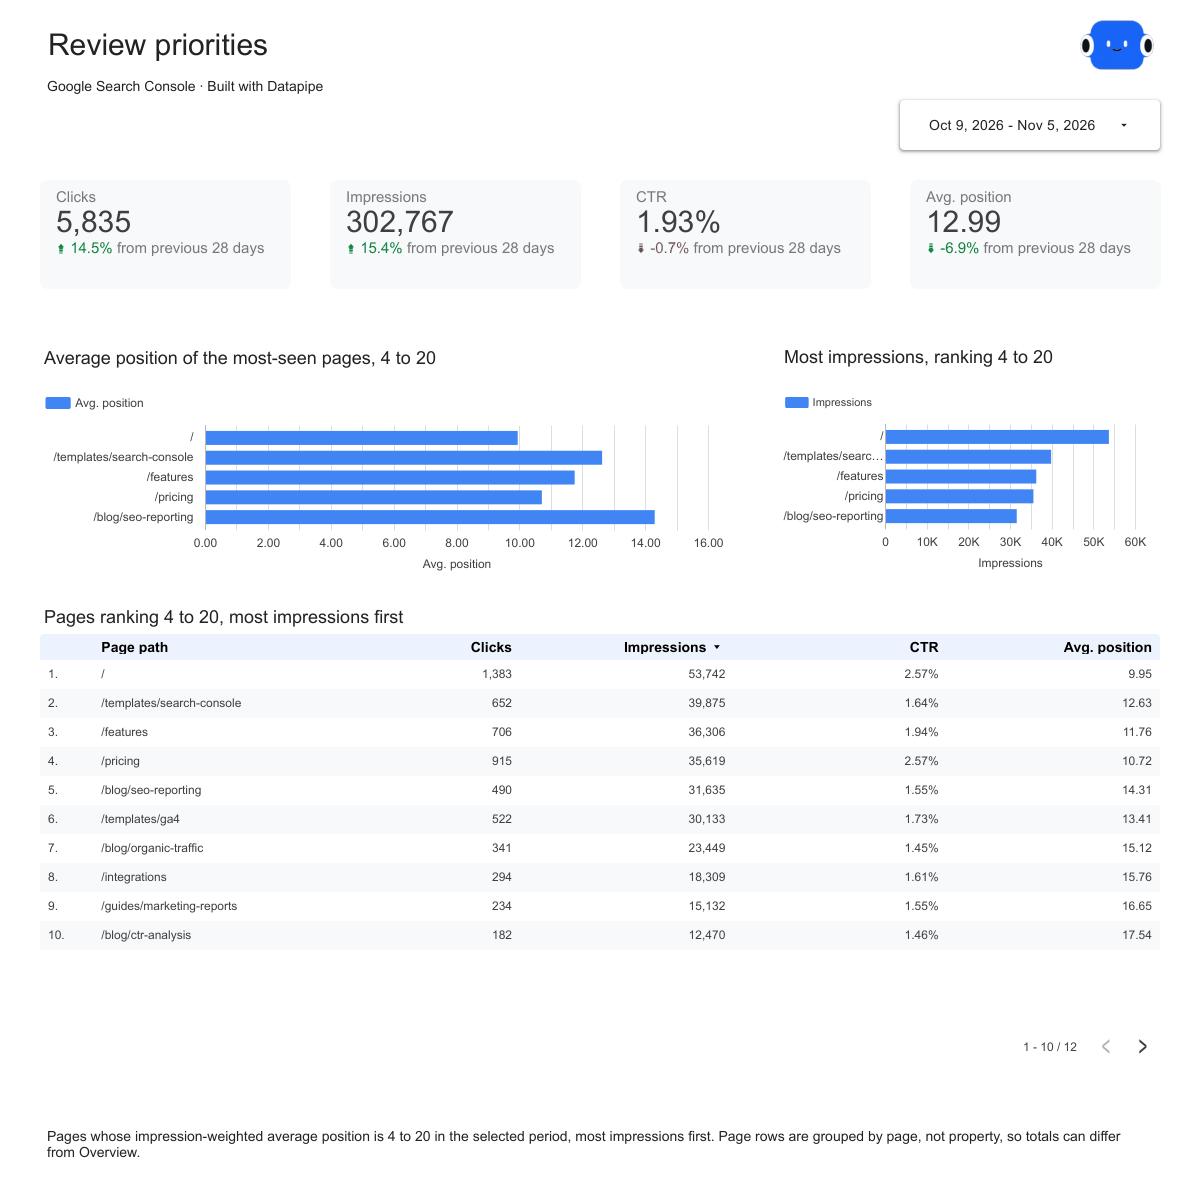
The SEO report template has a Review priorities page that lists pages with an impression-weighted average position between 4 and 20, most impressions first. That's next month's shortlist.
Step 5: Add GA4 for the outcomes
- Choose Add data source and pick the Google Analytics data source, then sign in and choose the client's property.
- In Reports, find GA4 Website Performance Report, click Use template, choose the property and save your copy.
- On the Acquisition page, set the Session channel filter to Organic Search.
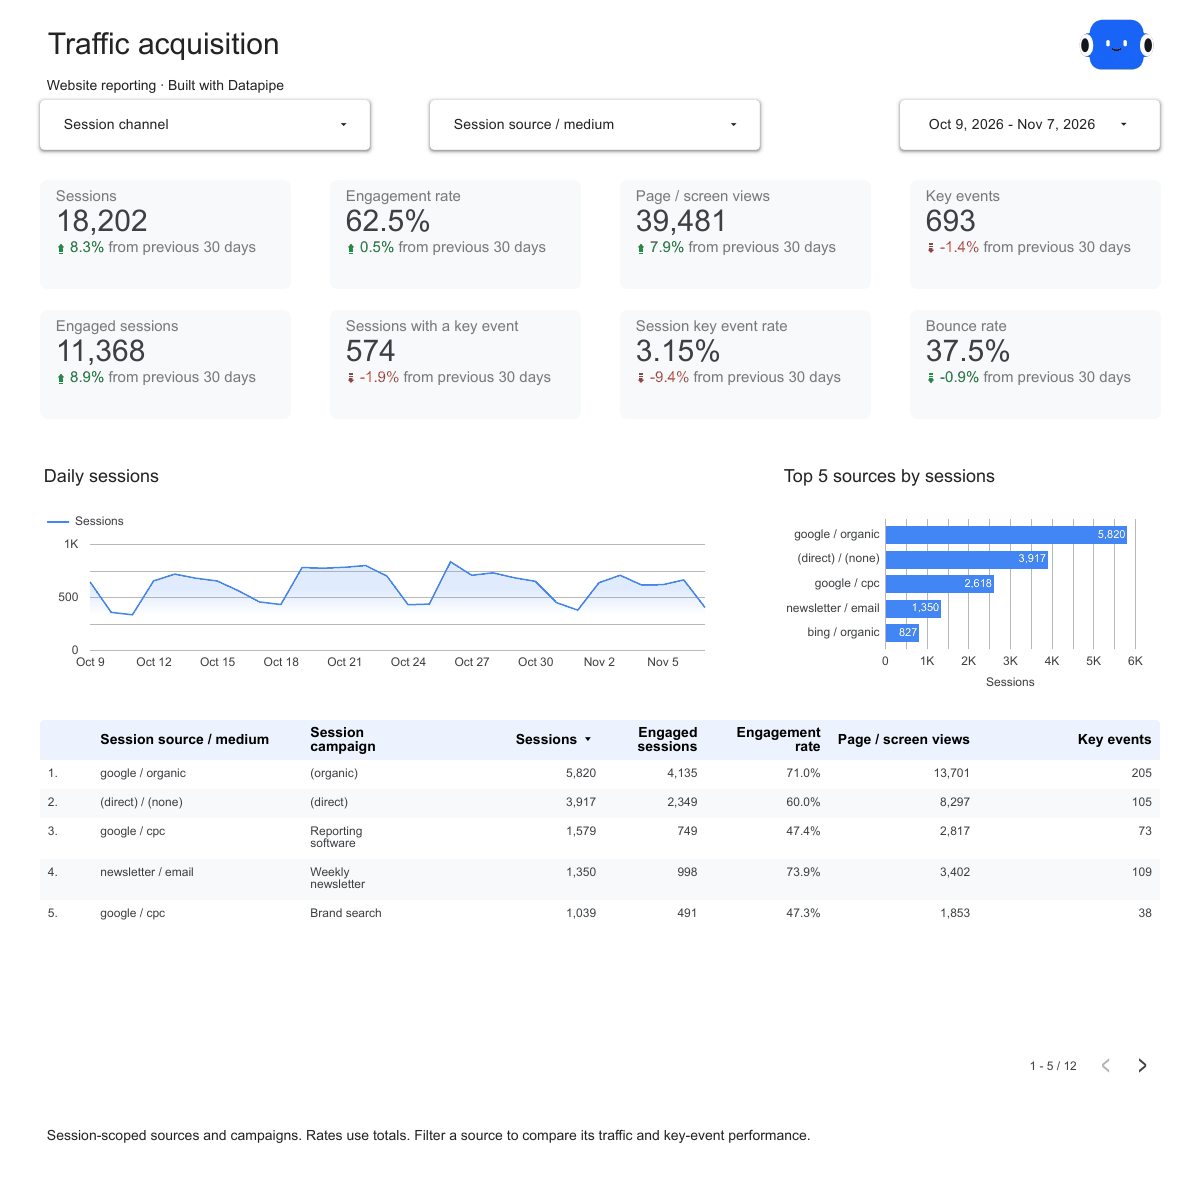
The GA4 report template then shows sessions, engaged sessions, engagement rate and key events for search visitors only. GA4 and Search Console count different things. Their numbers won't match, and our guide to GA4 vs Search Console organic traffic explains the gap.
Step 6: Send it every month
- Open the Search Console report's page in Datapipe.
- Use Add another report to add the SEO report and the GA4 report. They appear in order in one public link and one email.
- In Schedule & send, set the refresh and add the client's email.
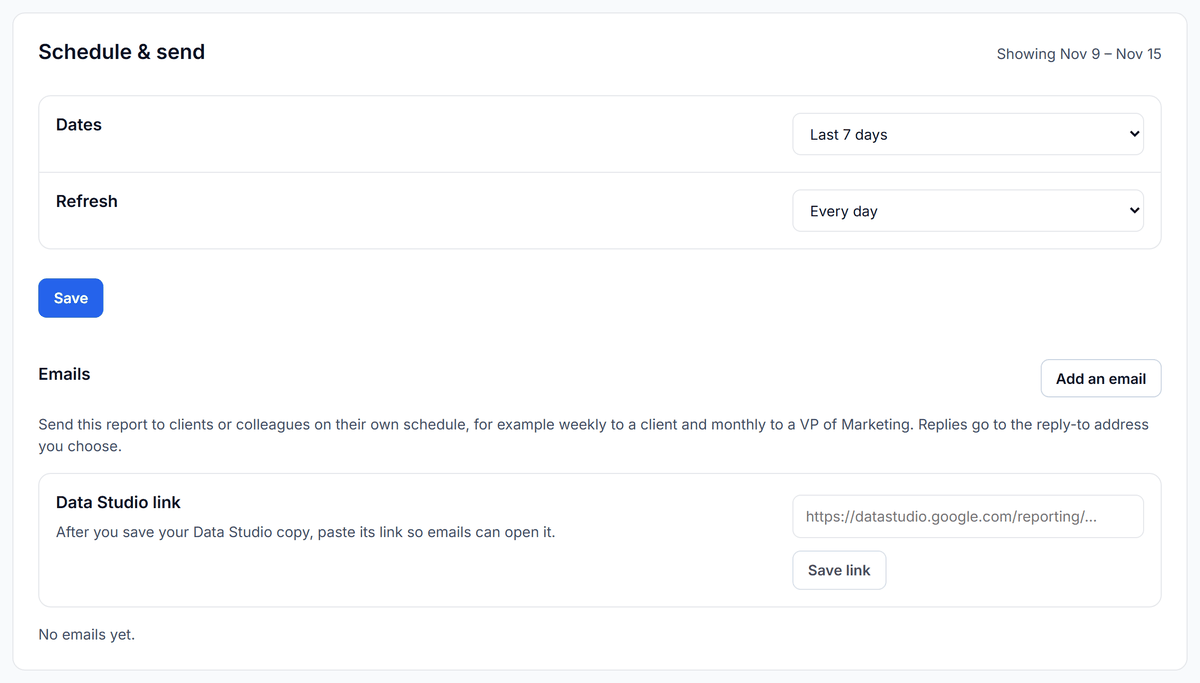
Free and Starter refresh daily, Pro hourly, and Agency every 15 minutes on up to 50 data sources, as listed on the Datapipe pricing page. If the client tracks target keywords in a rank tracker, add that report too; our list of the best rank tracking tools for agencies shows which ones Datapipe reads. The same goes for links, covered in the best backlink checkers for client reports.
A worked example
For example, take one month as the Search Console and SEO report templates show it in their previews.
| Metric | This period | Change from previous 28 days |
|---|---|---|
| Clicks | 5,954 | +14.5% |
| Impressions | 277,766 | +15.4% |
| CTR | 2.14% | down 0.8% |
| Average position | 12.34 | 7.1% lower, which is better |
Read it in this order.
- Clicks grew 14.5%. That's the headline.
- CTR fell slightly because impressions grew faster than clicks. The site appeared for more searches, many of them lower down the page. That's not a problem to fix.
- The brand split changes the story. In the top ten queries, the two brand searches bring 1,658 clicks at 16.29% and 10.49% CTR. The eight non-brand searches bring 3,065 clicks at under 2.1% each. The non-brand number is what SEO moved.
- The Review priorities page names next month's work. The /templates/search-console page has 39,875 impressions at position 12.63 and a 1.64% CTR. Moving it onto page one is worth more than any new page you could write this month.
Then add the GA4 numbers: organic key events and engaged sessions for the same month. Clicks up and key events flat? Fix the landing pages, not search.
Ask Claude or ChatGPT to write the monthly summary
The templates hold the numbers. An assistant connected to your Datapipe project can read Search Console and GA4 together and draft the summary. You check it and send it.
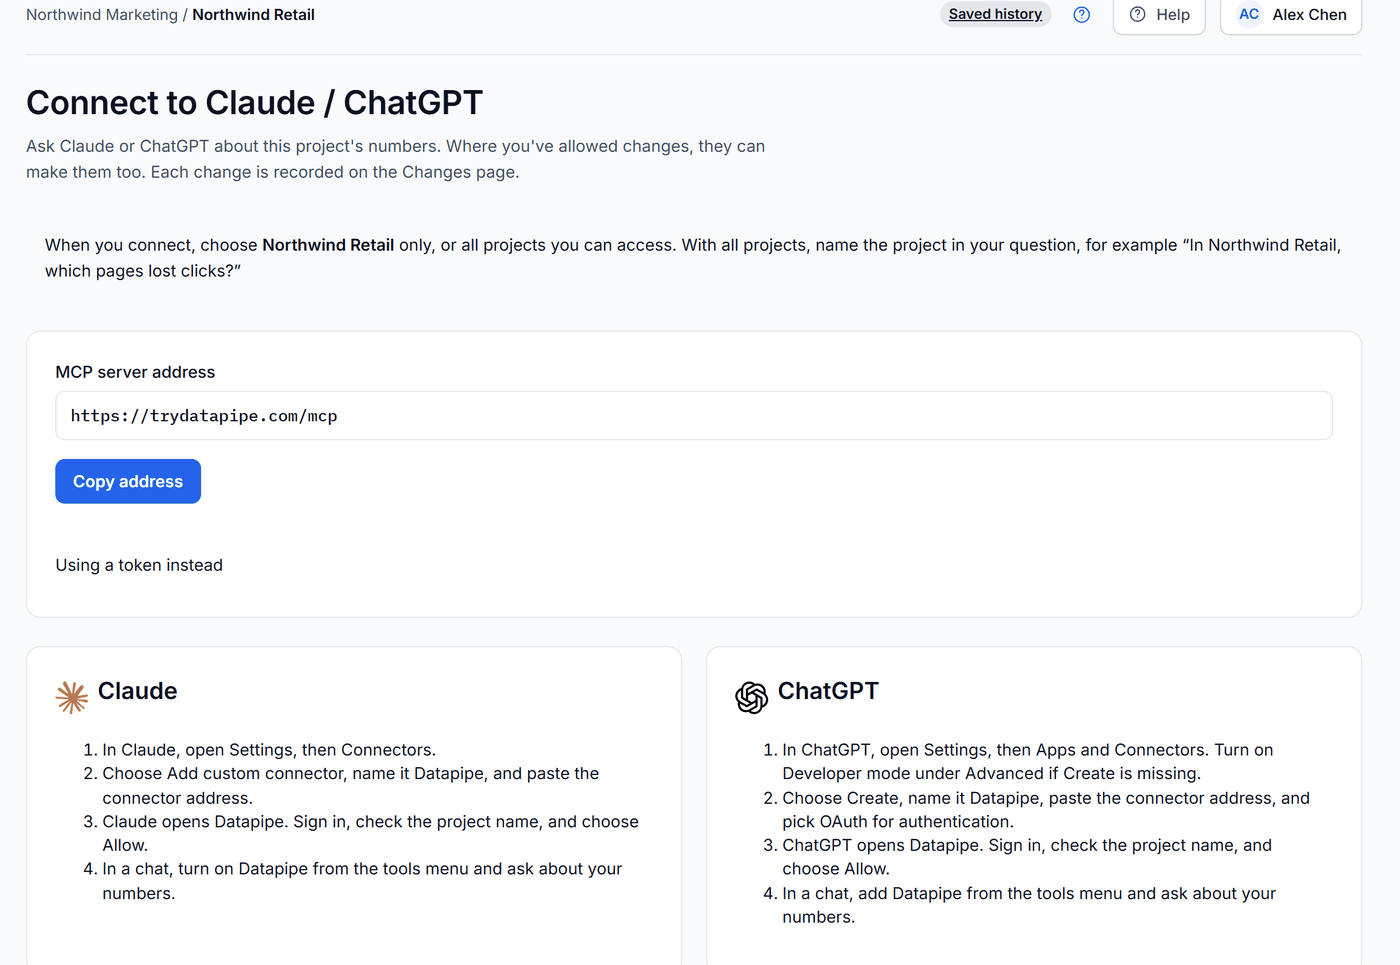
- In Datapipe, open Settings, then Claude / ChatGPT, and click Copy address.
- In Claude, open Customize, then Connectors, click + Add and choose Add custom connector, name it Datapipe and paste the address. In ChatGPT, open Settings, then Apps and Connectors, choose Create, name it Datapipe, paste the address and pick OAuth. No Create button? Turn on Developer mode under Advanced.
- Datapipe opens. Sign in, check the project name and choose Allow.
- Start a chat, turn on Datapipe from the tools menu and paste the prompts below in order. Swap in your project name, brand terms and month.
Read the month's search numbers.
In [project name], read Google Search Console for [month start] to [month end] and for the month before: clicks, impressions, ctr and position as property totals. Then read query rows for the same months and split clicks into brand and non-brand, where brand queries contain [brand terms]. Show both months side by side with the change. Don't change anything.
Find next month's pages and the outcomes.
In [project name], list pages for [month start] to [month end] with an impression-weighted average position between 4 and 20, most impressions first, with clicks, impressions and ctr. Then read Google Analytics for the same month: sessions, engagedSessions and keyEvents where sessionDefaultChannelGroup is Organic Search, with the month before for comparison. Don't change anything.
Write the client summary.
Using only the numbers from your last two answers, write a one-page SEO summary for the client. Lead with organic key events and non-brand clicks, explain any drop in CTR or average position in one sentence, and list the three pages to work on next with the reason for each. Don't change anything.
Troubleshooting the monthly SEO report
If brand and non-brand clicks don't add up to total clicks, that's expected. Query rows leave out anonymized searches. Report the split as a share of query clicks.
If this month's last few days look low, the date range reaches into days Google hasn't finished counting. End the month's report at least three days before you send it, or send it on the 4th.
If Search Console and GA4 disagree on organic visits, they count different things: clicks on Google results versus sessions that GA4 could record and attribute to search. Compare their trends, not their totals.
If average position got worse while clicks grew, check impressions. New appearances for long searches lower down the page pull the average down. Look at the position for the pages you're working on instead.
If organic key events show zero, check that the client's important events are marked as key events in GA4, and that the Session channel filter is set to Organic Search.
If the Review priorities page is empty, no page averaged position 4 to 20 in the selected dates, or the site is new. Widen the date range to 90 days.
Frequently asked questions
Which SEO metrics should I report to clients every month?
Organic key events, organic engaged sessions, Search Console clicks, non-brand clicks, and the pages ranking 4 to 20 with the most impressions, plus the work you did and the plan for next month. Put impressions, CTR and average position next to clicks to explain them.
Should I report Domain Authority to clients?
Not as a headline. Domain Authority and Domain Rating are scores from SEO tools' own models, not measures Google uses, and they can rise while traffic falls. If links are part of the work, report new referring domains to the pages you're trying to rank.
Why did average position get worse when clicks went up?
Average position covers every search the site appeared for. When the site starts showing for many new searches lower down the results, the average gets worse even while clicks grow. Look at position for the pages or queries you're working on instead.
How do I separate brand and non-brand clicks in Search Console?
Add a calculated field to the queries in Data Studio, such as CASE WHEN REGEXP_CONTAINS(Query, "(?i)brand|brand name") THEN "Brand" ELSE "Non-brand" END, with the client's brand terms and misspellings in the pattern. Query rows leave out anonymized searches, so report the split as a share of query clicks.
Why don't Search Console clicks match GA4 organic sessions?
Search Console counts clicks on Google results. GA4 counts sessions it could record and attribute to search, which depends on consent, tracking and how GA4 groups channels. Compare the trends, not the totals.
How do I automate a monthly SEO report?
In Datapipe, add Search Console and Google Analytics to a project, copy the Search Console, SEO and GA4 report templates, put them in one link with Add another report, then set the schedule and recipients in Schedule & send. The Free plan includes 3 data sources with a daily refresh.
Put your marketing numbers on autopilot
Datapipe connects your data sources and keeps your reports refreshed on a schedule.
Start free