Facebook Ads vs Shopify: why Meta reports more sales than your store
Why Meta reports more purchases than Shopify has orders, which numbers you can compare, and how to build one Facebook Ads and Shopify report with copy-ready prompts.

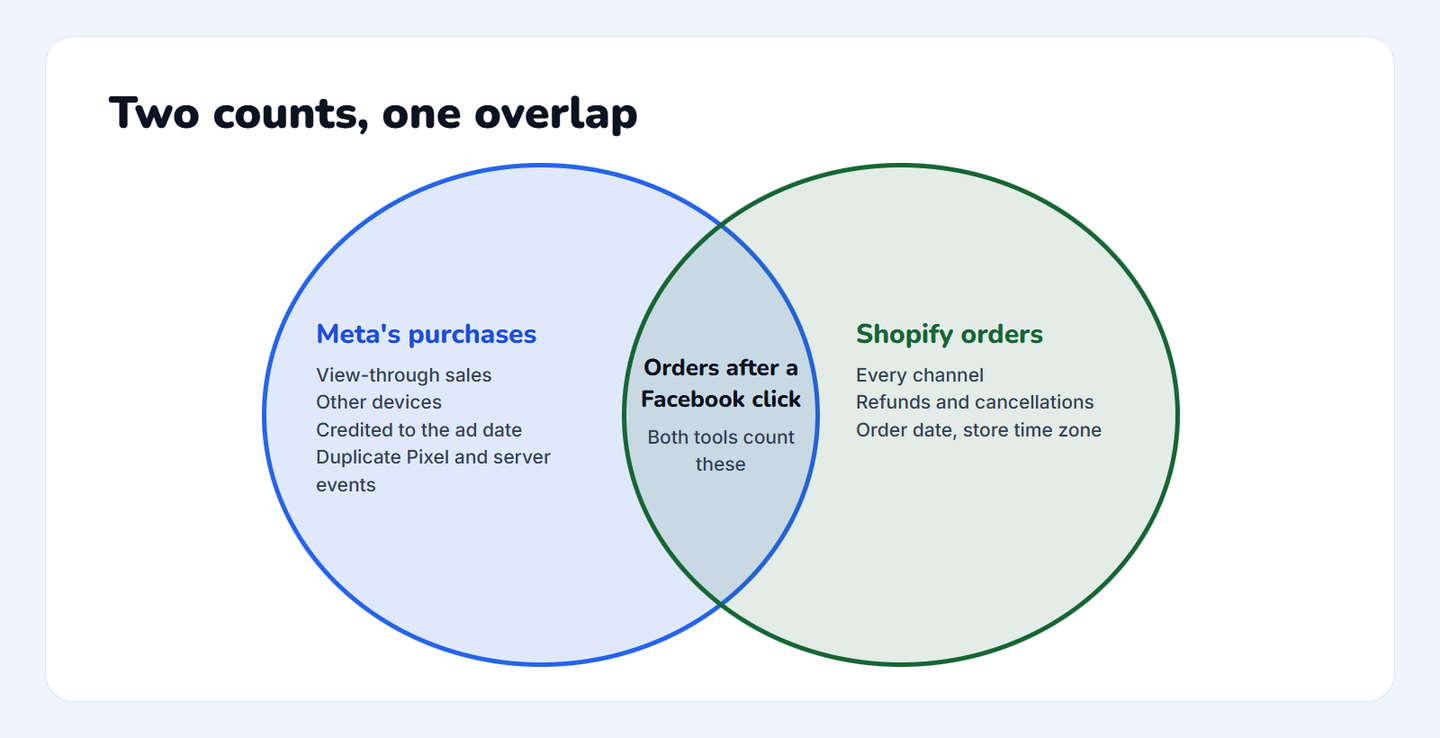
Meta reports more sales than Shopify because the two count different things. Meta counts the purchases it credits to your ads, including people who only saw an ad and bought later, often on another device. Shopify counts the orders your store actually took, from every channel. Report both, label which is which, and judge the budget on Shopify revenue against Meta spend.
This guide shows why the gap opens, which numbers you can put side by side and which you can't, and how to build one report with both in Datapipe. It ends with three assistant prompts you can copy to find the Shopify orders that really came from Facebook.
What you'll need before you start
You need a Facebook user with reporting access to the client's ad account, and access to install an app on the Shopify store (or the store owner on hand to approve it).
You also need a Datapipe account. The Free plan includes 3 data sources with a daily refresh, enough for one client's ad account and store plus their GA4 property. And a Google account, to save your copies of the reports in Data Studio.
One thing helps more than anything else: tag every ad with UTM parameters. If you followed our guide to combine Facebook Ads and GA4 in one report, your ads already carry this string in the URL parameters field:
utm_source=facebook&utm_medium=paid_social&utm_campaign={{campaign.name}}&utm_content={{ad.id}}Shopify keeps the address each buyer landed on, tags included. That's how you'll find the orders that came from a Facebook click.
Why Meta and Shopify never match
The gap comes from five differences. Most accounts have three or four of them at once, so expect Meta's number to sit above Shopify's Facebook orders every month.
Meta counts people who only saw the ad
Datapipe reads Facebook Ads with a 7-day click and 1-day view attribution window. A purchase counts if the buyer clicked an ad in the 7 days before, or saw one in the day before without clicking. Shopify can't see a view. To Shopify, that buyer typed your address or came from Google, and the order belongs to that channel.
Meta files the sale under the day of the ad
Meta reports a purchase on the date of the ad impression, not the date of the order. Someone who clicks on Sunday and buys on Thursday shows up on Sunday in Meta and Thursday in Shopify. Weekly totals drift apart even when both tools agree on the sale.
Meta follows people across devices
A buyer who taps an ad on their phone at lunch and orders on a laptop that evening is one Meta purchase. In Shopify, that order arrives with no Facebook tag, because the laptop visit never touched the ad.
The same purchase can arrive twice
Stores that send purchases through both the Meta Pixel and the Conversions API need a shared event ID on both. Meta's guide to deduplicating Pixel and server events says matching events are dropped only when the event ID and event name match and arrive within 48 hours. Get that wrong and every order counts twice.
Shopify takes refunds and cancellations back
A refunded order stays a purchase in Meta. Shopify's current total drops when the money goes back, and cancelled orders leave your paid count. A store with a high return rate will always look worse in Shopify than in Ads Manager.
Which numbers belong together
Put a Meta number next to a Shopify number only when both describe the same thing over the same complete days. These pairs work.
| Pair | Tells you | Watch out for |
|---|---|---|
| Meta spend and Shopify paid order total | Blended return: what the store took for each dollar on Meta | Includes sales from every channel, so it's a budget check, not ad credit |
| Meta website purchases and Shopify orders tagged utm_source=facebook | How much of Meta's claim you can trace to a click | Expect Meta to be higher; view-through and other devices never carry a tag |
| Meta website purchase value and Shopify current total for tagged orders | How refunds shrink what the ads earned | Refunds land weeks later, so read complete months |
| Meta purchases by week and Shopify orders by week | Whether both move together after a campaign change | Meta dates by ad impression, Shopify by order |
Which numbers don't
Some combinations look reasonable and mislead a client every time.
| Tempting pair | Why it misleads | Use instead |
|---|---|---|
| Meta purchases minus Shopify orders, called "fake sales" | Most of the gap is view-through and other devices, which really happened | Show tagged orders as the floor and Meta's purchases as the ceiling |
| Meta ROAS next to Shopify revenue divided by all ad spend | Different numerators, different spend | Pick one: Meta's ROAS for ad decisions, blended return for budget |
| Website purchases plus omni purchases | Omni purchases already include website purchases | Report website purchases for a Shopify store |
| Shopify orders from today against Meta's today | Meta keeps adding purchases for 7 days after a click | Compare complete weeks that ended at least 7 days ago |
Step 1: Add Shopify to your Datapipe project
Shopify signs in with an app install, so there's no key to copy.
- In Datapipe, open Data sources, choose Add data source and pick the Shopify data source.
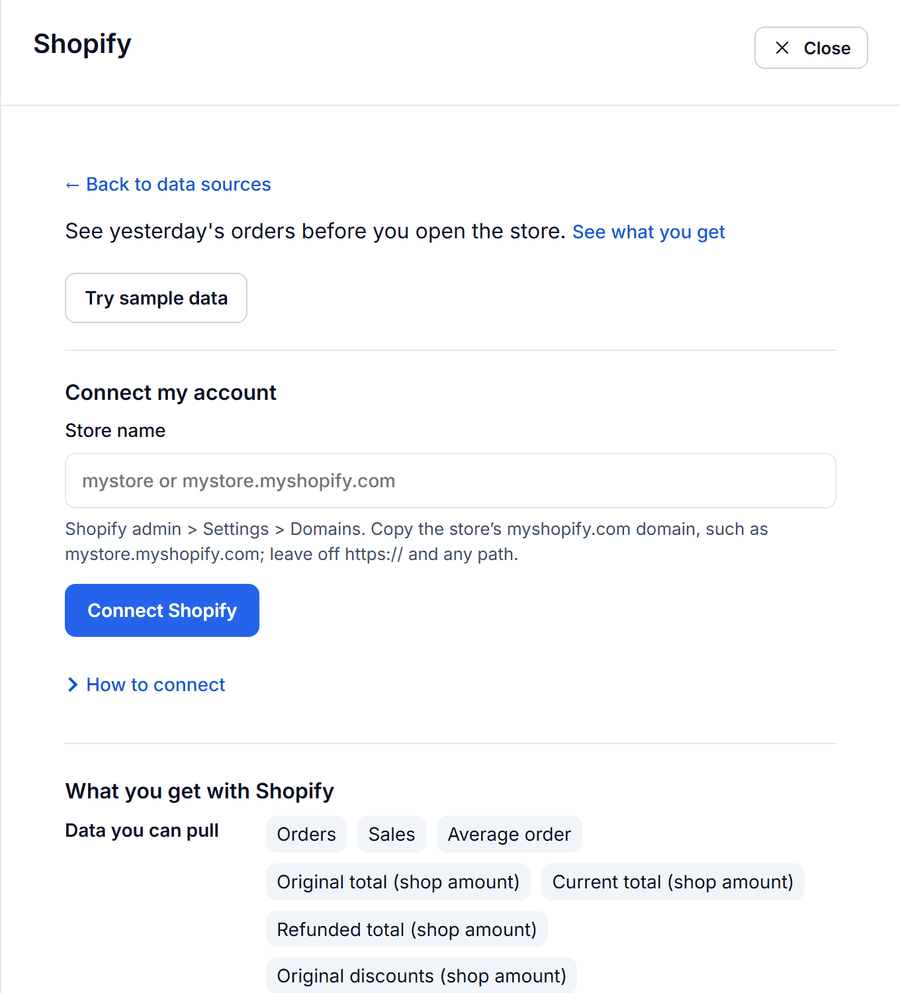
- Enter the store's address as mystore or mystore.myshopify.com and click Connect Shopify.
- Sign in to the store, review the requested access and approve the installation. You land back on the project's data sources.
Step 2: Add Facebook Ads to the same project
Add the ad account to the same project, so both sources share one report link.
- In Add data source, pick the Facebook Ads (Meta Ads) data source.
- Click Sign in with Facebook with the user that has reporting access, and include the client's ad account when Meta asks which permissions to grant.
- Back in Datapipe, click Load / refresh ad accounts, choose the ad account by name and click Add data source.
Live Meta Ads reporting starts once Meta approves Datapipe's access. Until then, set up the Shopify side and copy the Meta template so it's ready.
Step 3: Copy the Shopify report template
The Shopify report shows what the store actually took, after refunds.
- Open Reports, find Shopify Sales Report under Data Studio dashboards and click Use template.
- Choose the store and click Open my dashboard, then save your copy in Data Studio.
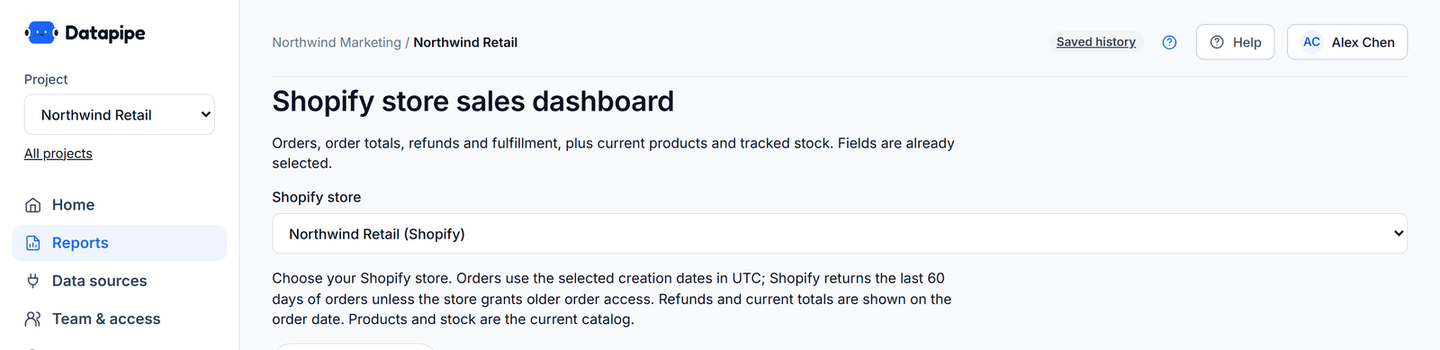
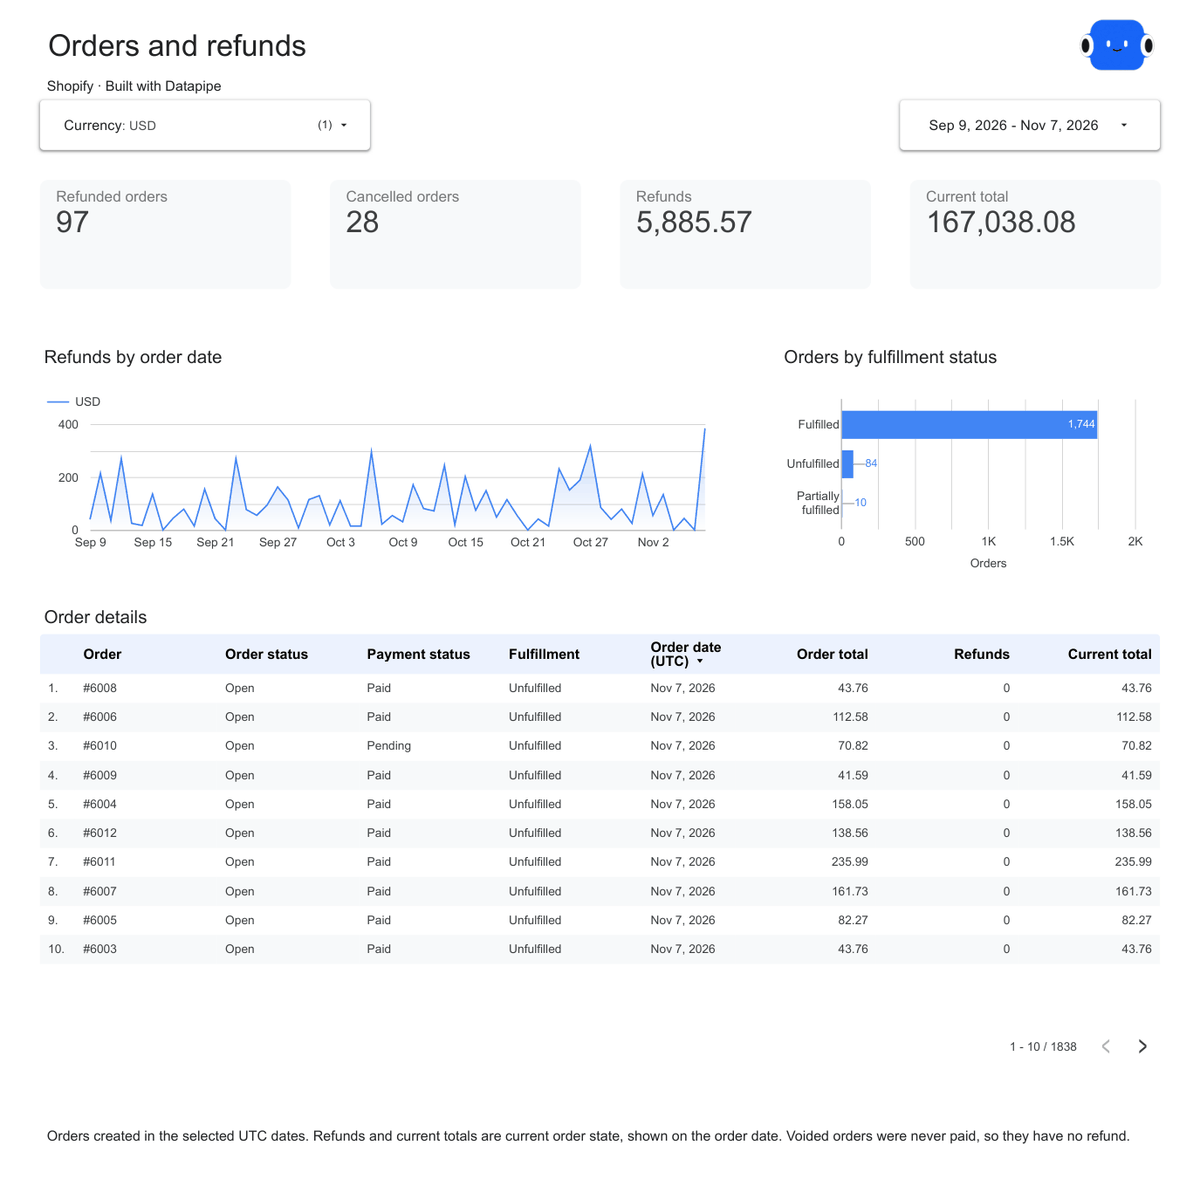
The Shopify report template opens on Overview: order total, orders, average order value and refund rate, with daily sales. The Orders and refunds page, above, is the one to show next to Meta. It lists refunded and cancelled orders and gives a current total that already takes refunds out. Products and stock lists current variants, prices and units in stock.
Step 4: Copy the Meta Ads report template
The Meta report shows what the ads claim, with Meta's attribution kept visible.
- In Reports, find the Meta Ads dashboard under Data Studio dashboards and click Use template.
- Choose the ad account, click Open my dashboard and save your copy in Data Studio.
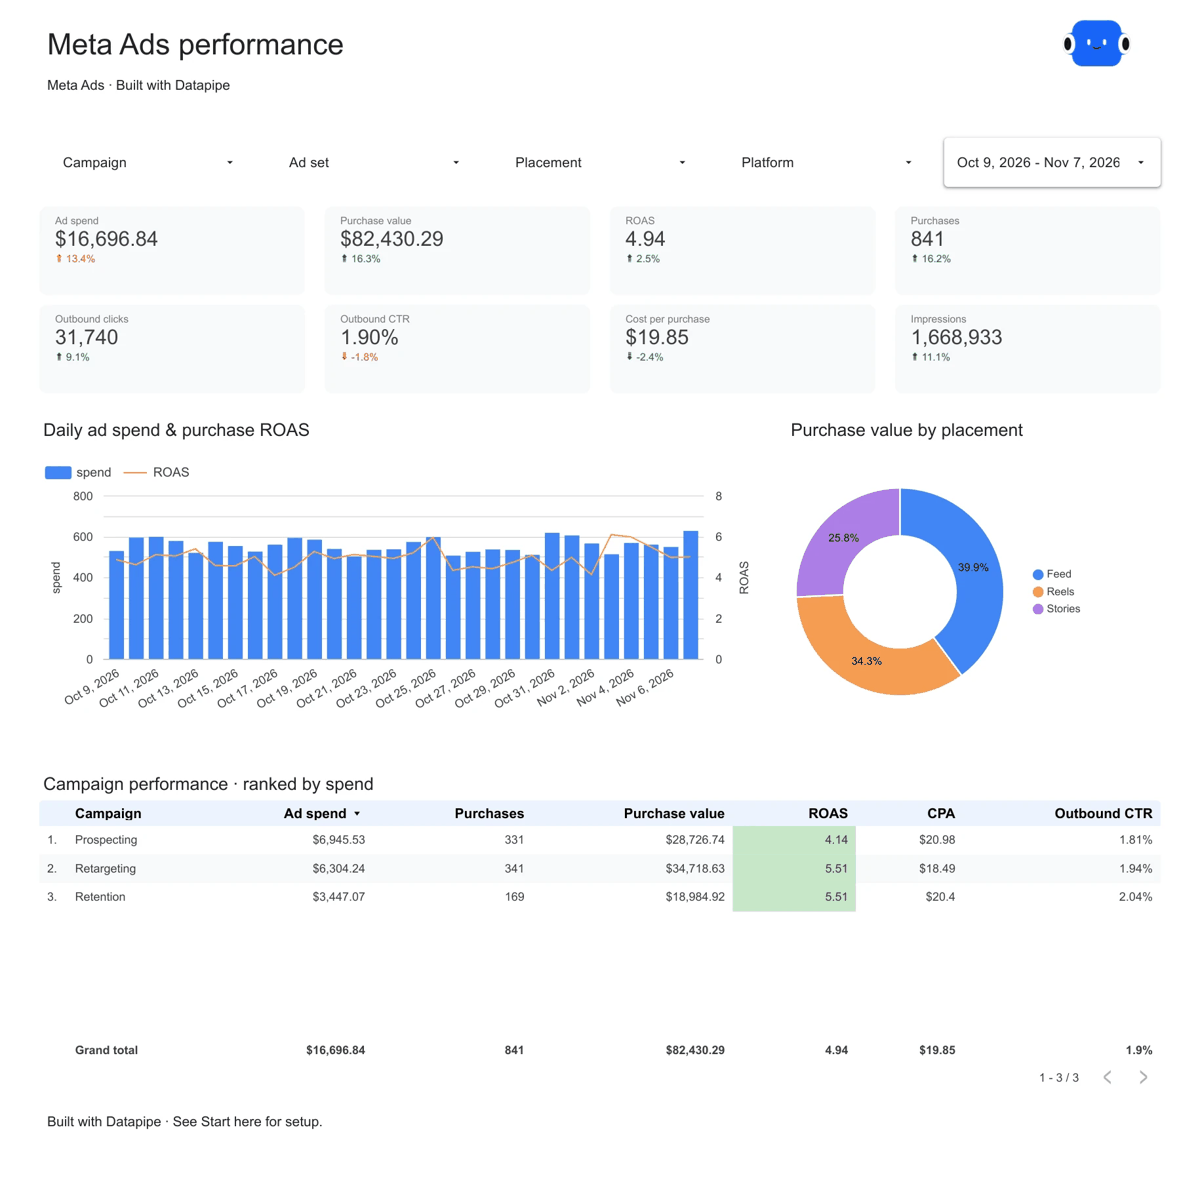
The Meta Ads ROAS report template opens on Overview: ad spend, purchase value, ROAS and purchases, with daily spend and ROAS and a campaign table ranked by spend. ROAS there is total purchase value divided by total spend, not an average of each row's ROAS. Ads and creative compares formats by purchase results and cost, Video covers hook and hold rates, and Reach and fatigue plots daily frequency against cost per purchase.
Step 5: Put both reports in one link
- Open the Meta Ads report's page in Datapipe.
- Use Add another report to add the Shopify report. It shows below the Meta report with the same dates and goes out in the same public link and email.
- In Schedule & send, set the refresh and add who gets the email.
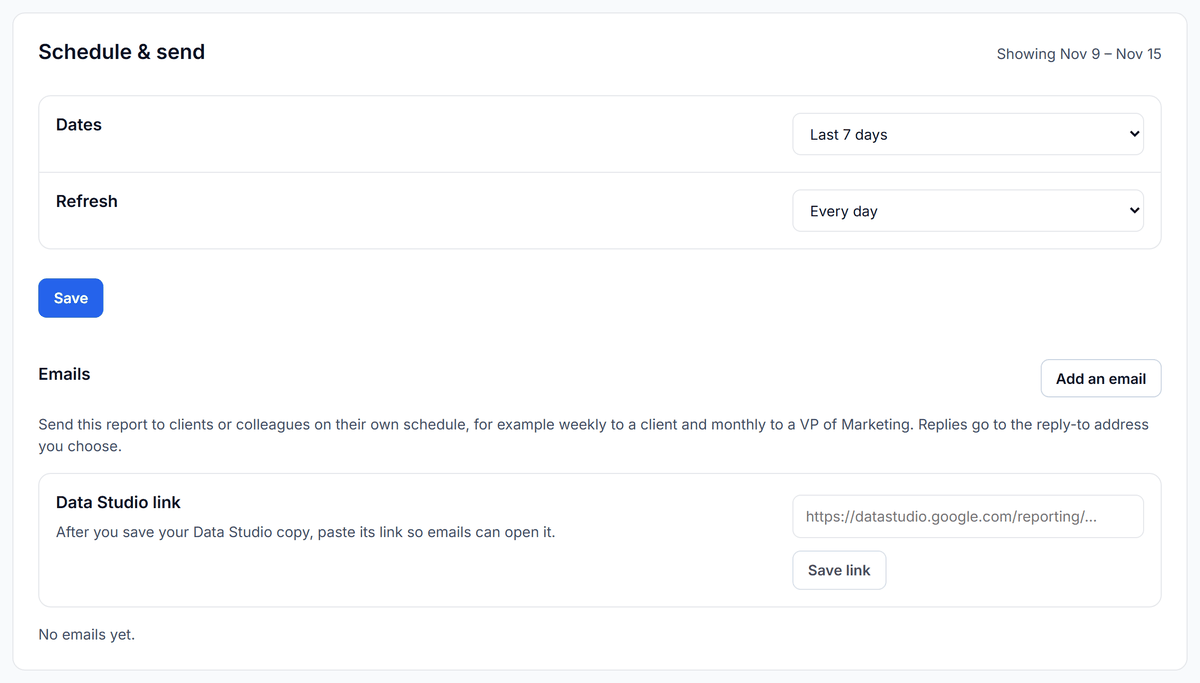
Free and Starter refresh daily, Pro hourly, and Agency every 15 minutes on up to 50 data sources, as listed on the Datapipe pricing page.
A worked example
For example, say a store's October looks like this. Meta reports 120 website purchases worth $9,600 on $3,000 of spend, a ROAS of 3.2. Shopify shows 410 paid orders worth $31,200 across every channel, and 72 of them landed with utm_source=facebook in the address.
Don't tell the client Meta invented 48 sales. Read it in three layers:
- 72 orders are certain. Someone clicked a Facebook ad and bought in that visit. That's the floor.
- Up to 120 are plausible. The other 48 are Meta's view-through and other-device credit. Some are real, some would have happened anyway, and no tool can split them exactly.
- The budget question uses the store. $31,200 of Shopify revenue on $3,000 of Meta spend is a blended return of 10.4. If that number holds or rises when you raise the Meta budget, the ads are working, whatever the attribution says.
Then check refunds. If 9 of the 72 tagged orders were refunded, the Orders and refunds page shows it, and the ads earned less than either first number suggests.
Here's the stance: stop trying to make Meta and Shopify match. They answer different questions. Meta's number tells you which ads to keep, and Shopify's tells you whether the spend paid off.
Ask Claude or ChatGPT to find the Facebook orders
The report shows totals. The order-by-order match is a job for an assistant connected to your Datapipe project, because it reads every order's landing address and keeps the unmatched ones visible.
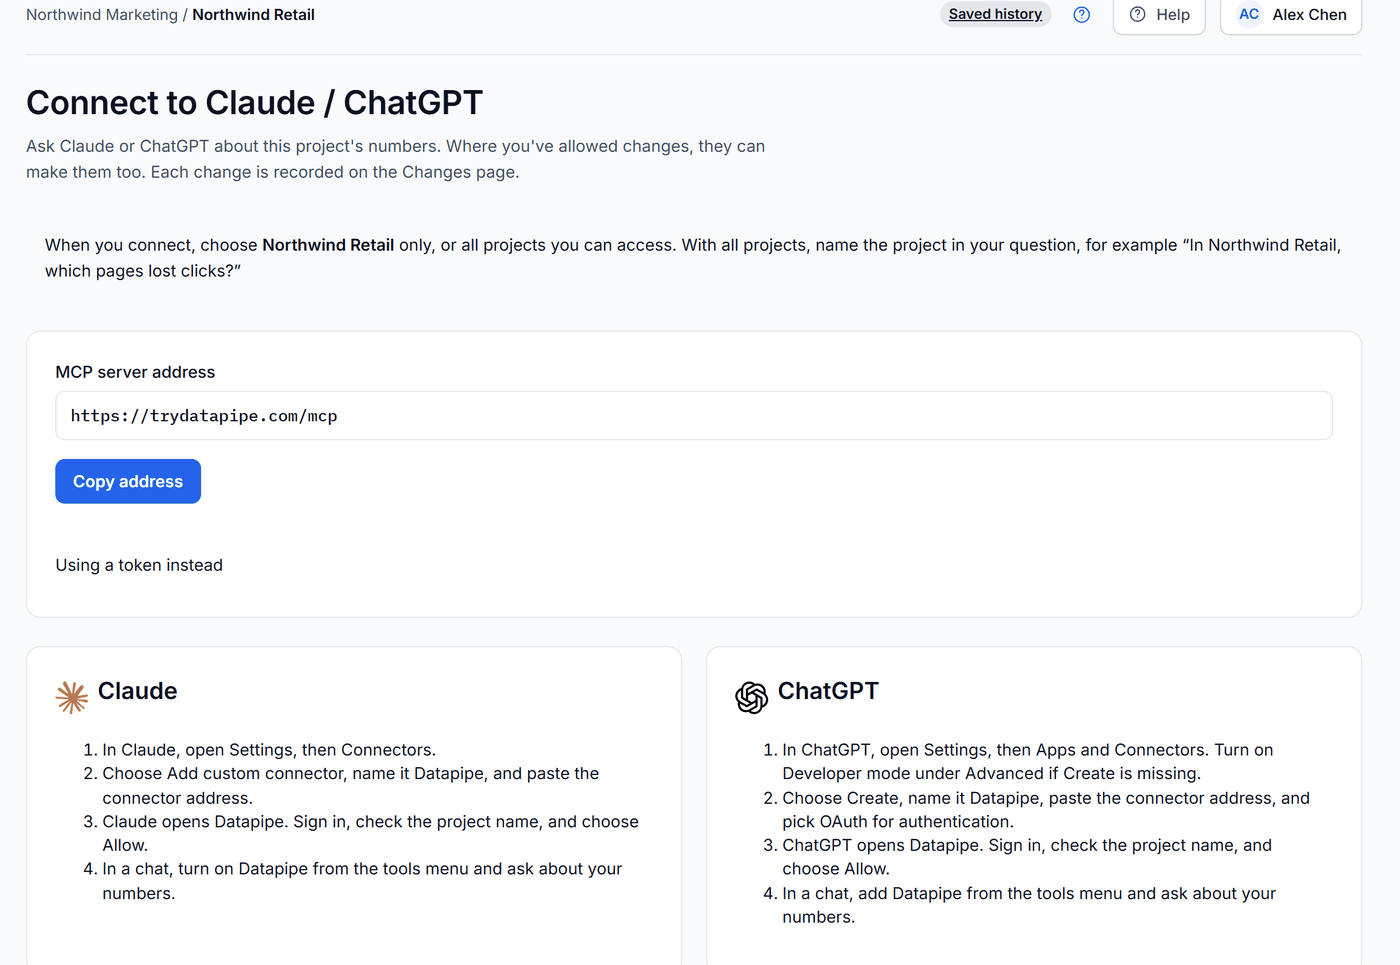
- In Datapipe, open Settings, then Claude / ChatGPT, and click Copy address.
- In Claude, open Settings, then Connectors, choose Add custom connector, name it Datapipe and paste the address. In ChatGPT, open Settings, then Apps and Connectors, choose Create, name it Datapipe, paste the address and pick OAuth. No Create button? Turn on Developer mode under Advanced.
- Datapipe opens. Sign in, check the project name and choose Allow.
- Start a chat, turn on Datapipe from the tools menu and paste the prompts below in order. Swap in your project name and dates.
Count the store's orders and the Facebook ones.
In [project name], read Shopify orders created from [start date] to [end date]: order_number, created_at, financial_status, cancelled_at, total_price, currency, landing_site, referring_site and source_name. Count paid orders that weren't cancelled, with their total. Then count the orders whose landing_site contains utm_source=facebook, or whose referring_site contains facebook.com or instagram.com, with their total. Show both counts and list any order you couldn't classify. Don't change anything.
Put Meta's claim next to them.
In [project name], read Facebook Ads spend, website_purchases and website_purchase_value by week for the same dates, with account_currency. Put them next to the weekly count and value of the Facebook-tagged Shopify orders from your last answer. Don't add omni purchases. For each week, explain the gap using Meta's 7-day click and 1-day view attribution and say which weeks look unusual. Don't change anything.
Write the client note.
Using only the numbers from your last two answers, write a short note for the client. Give tagged Shopify orders as the floor, Meta's website purchases as the ceiling, and Shopify's paid order total divided by Meta spend as the blended return. Say what each number means in one sentence. Don't change anything.
If Meta reports at least twice the tagged orders every week, check the deduplication first. If the ratio jumps in one week only, look for an ad whose link lost its tags.
If you also run GA4, the use case to compare Facebook Ads, GA4 and Shopify performance adds GA4's purchase events as a third view of the same path to purchase. For a transaction-by-transaction check of GA4 against the store, see how to reconcile GA4 purchases with Shopify orders.
Troubleshooting the Meta and Shopify report
If Meta reports twice as many purchases as Shopify has orders in total, you're probably double counting. Check that the Pixel and the Conversions API send the same event ID for each purchase.
If no Shopify orders carry utm_source=facebook, the tags aren't reaching the store. Open one of your ads' links and check that the address still has the parameters after any redirect.
If the weeks don't line up, compare complete weeks that ended at least 7 days ago. Meta keeps crediting purchases to a week for up to 7 days after it ends.
If totals differ by a few percent with no pattern, check the currency and time zone. Meta uses the ad account's, Shopify uses the store's, and a store in one time zone with an ad account in another splits days differently.
If older Shopify orders are missing, Shopify shares the last 60 days of orders unless it approves access to older orders for the app. Keep the comparison inside that window.
Frequently asked questions
Why does Facebook Ads show more purchases than Shopify?
Meta credits purchases to your ads that Shopify can't link to a click: people who saw an ad without clicking and bought within a day, and people who clicked on one device and ordered on another. Meta also files each sale under the date of the ad, keeps refunded orders, and can count one purchase twice if the Pixel and the Conversions API don't share an event ID.
Which number should I trust, Meta or Shopify?
Both, for different questions. Use Shopify for revenue, because it's the money the store actually took after refunds. Use Meta's purchases to compare ads and campaigns with each other. For the budget decision, divide Shopify's paid order total by Meta spend and watch whether it holds when the spend changes.
How do I see which Shopify orders came from Facebook ads?
Tag every ad with UTM parameters, then look at each order's landing site in Shopify. Orders whose landing address contains utm_source=facebook came from a Facebook click in that visit. Orders that only saw an ad, or switched devices, won't carry the tag, so this count is a floor, not the full picture.
Which attribution window does Datapipe use for Facebook Ads?
Datapipe reads Facebook Ads with a 7-day click and 1-day view window: a purchase counts if the buyer clicked an ad in the previous 7 days or saw one in the previous day. Because of that, compare complete weeks that ended at least 7 days ago.
Should I report Meta ROAS or blended ROAS to clients?
Show both, labelled. Meta's ROAS is purchase value Meta credits to the ads divided by ad spend, and it's the right number for choosing between ads. Blended return is the store's revenue from every channel divided by ad spend, and it's the honest check on whether the total budget pays off.
Put your marketing numbers on autopilot
Datapipe connects your data sources and keeps your reports refreshed on a schedule.
Start free