Are you earning more visibility?
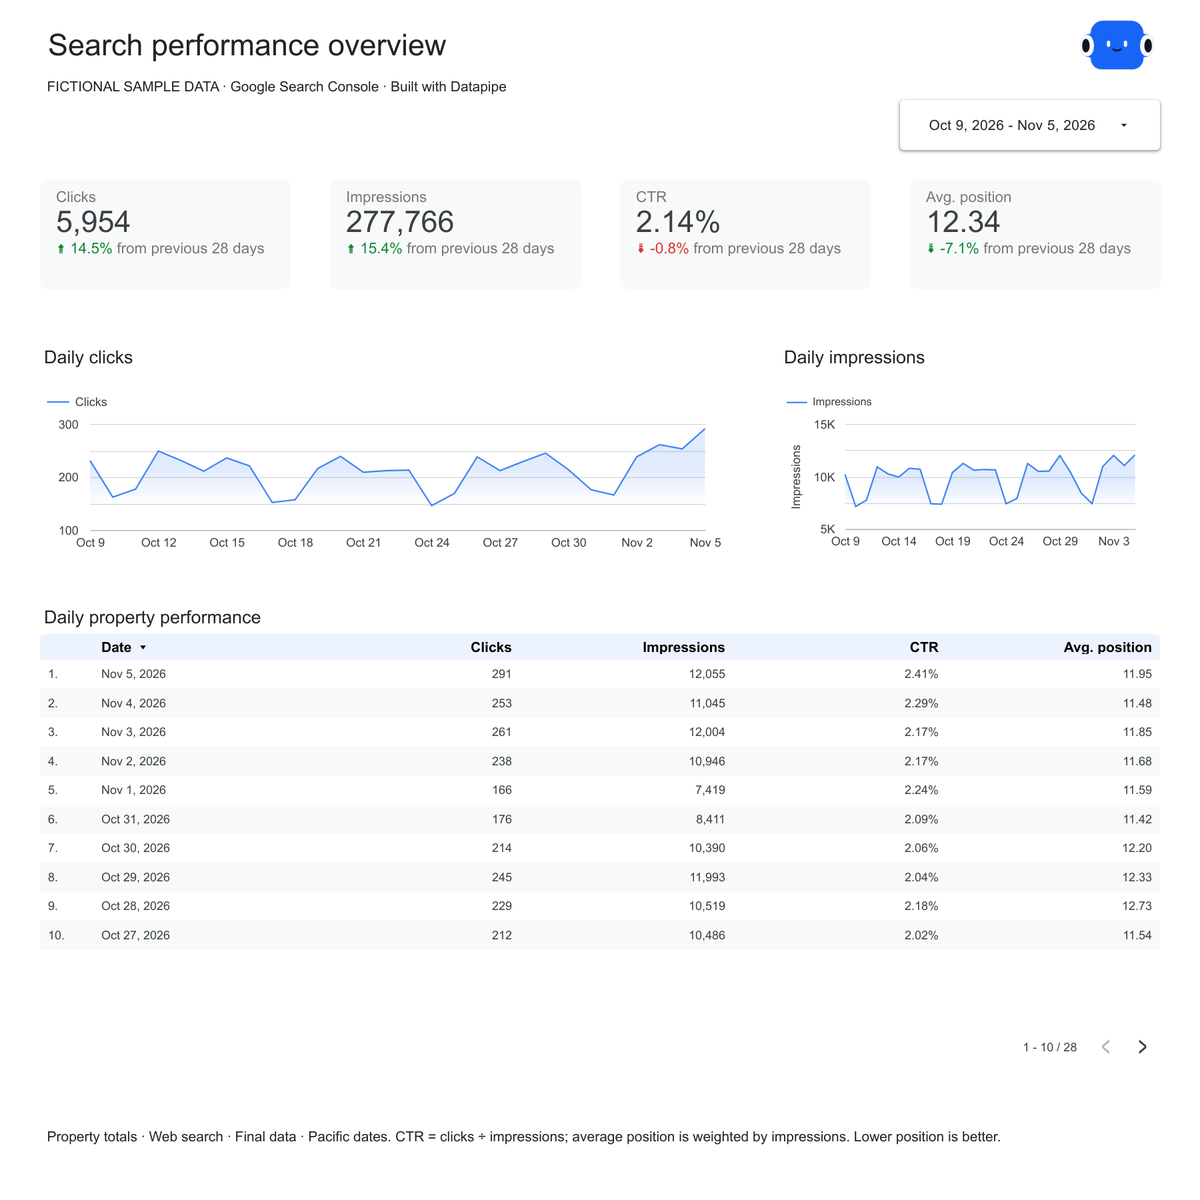
Compare clicks and impressions across equal periods. See the daily pattern behind the headline.
 Datapipe
 Google Search Console · Data Studio
See what gets seen.
Find what earns the click.
Clicks, search terms, pages, devices and countries. Six editable pages to explain your organic search performance.
Fictional sample data. A Google account is needed to save a copy.
New live connections: Google verification is still required.
Choose a page to see the actual dashboard.
Compare clicks and impressions across equal periods. See the daily pattern behind the headline.
Review the terms and landing pages behind a change, with their own correctly aggregated totals.
Compare devices and countries to find differences worth checking on your website.
Live setup is currently limited. New Google Sheets connections show Google’s unverified-app warning. Existing authorized projects can continue. You can preview, copy and download the fictional sample now.
Sign in to Datapipe and choose the website property you can access.
Authorize Google Sheets separately. Datapipe prepares the five reporting worksheets.
Open the prepared Data Studio link. Scheduled exports refresh the same workbook.
Search ConsoleDatapipe Google Sheets
 Data Studio
Google property access and separate Sheets authorization are required. Datapipe plans apply to live refreshes. Empty real results stay empty; the prepared copy link appears after a populated export.
New Google Sheets connections currently show Google’s unverified-app warning. Google app verification is still required for a smooth new-customer setup. Existing authorized projects can continue; the fictional sample preview, free copy, PDF and CSV remain available.
Start with clicks, impressions, CTR and average position over equal periods. Then review queries, pages, devices and countries. This template keeps property totals separate from query and page datasets.
Add Google Search Console as a data source in Datapipe, select the intended property and create this dashboard. Authorize Google Sheets separately. Datapipe prepares five worksheets and a copy link that replaces all five report sources. Save your private Data Studio report; scheduled exports update the same workbook.
The fictional sample, editable Data Studio copy, PDF and CSV are free. You need a Google account to save a copy. Datapipe plans apply when you connect and refresh your own data.
Google omits some query data for privacy. Page-level and property-level aggregation also count impressions and positions differently. These differences are preserved, not combined into misleading totals. API results may contain only top rows.
CTR uses total clicks divided by total impressions. Average position uses the sum of each native row’s position multiplied by impressions, divided by total impressions. Lower average position is better. Neither metric is an unweighted average of row percentages or positions.
The dashboard reads finalized Web search data. Its default window is 28 days ending three days before today to allow for Google’s reporting delay. Dates use Pacific time. A property with no results stays empty; Datapipe does not substitute fictional rows.
Yes. Edit your own copy’s logo, titles, colors and layout in Data Studio. The six-page PDF shown here is exported from the same native dashboard and labeled fictional sample data. Tables are paginated; the sample CSV includes the full fictional dataset.
No. This template covers finalized Web search performance. Revenue, indexing status and separate AI Overview metrics are not included in these Search Console datasets.