Datapipe
Start free
← All report templates

PageOptimized · Free Data Studio template

PageOptimized rank tracking report template
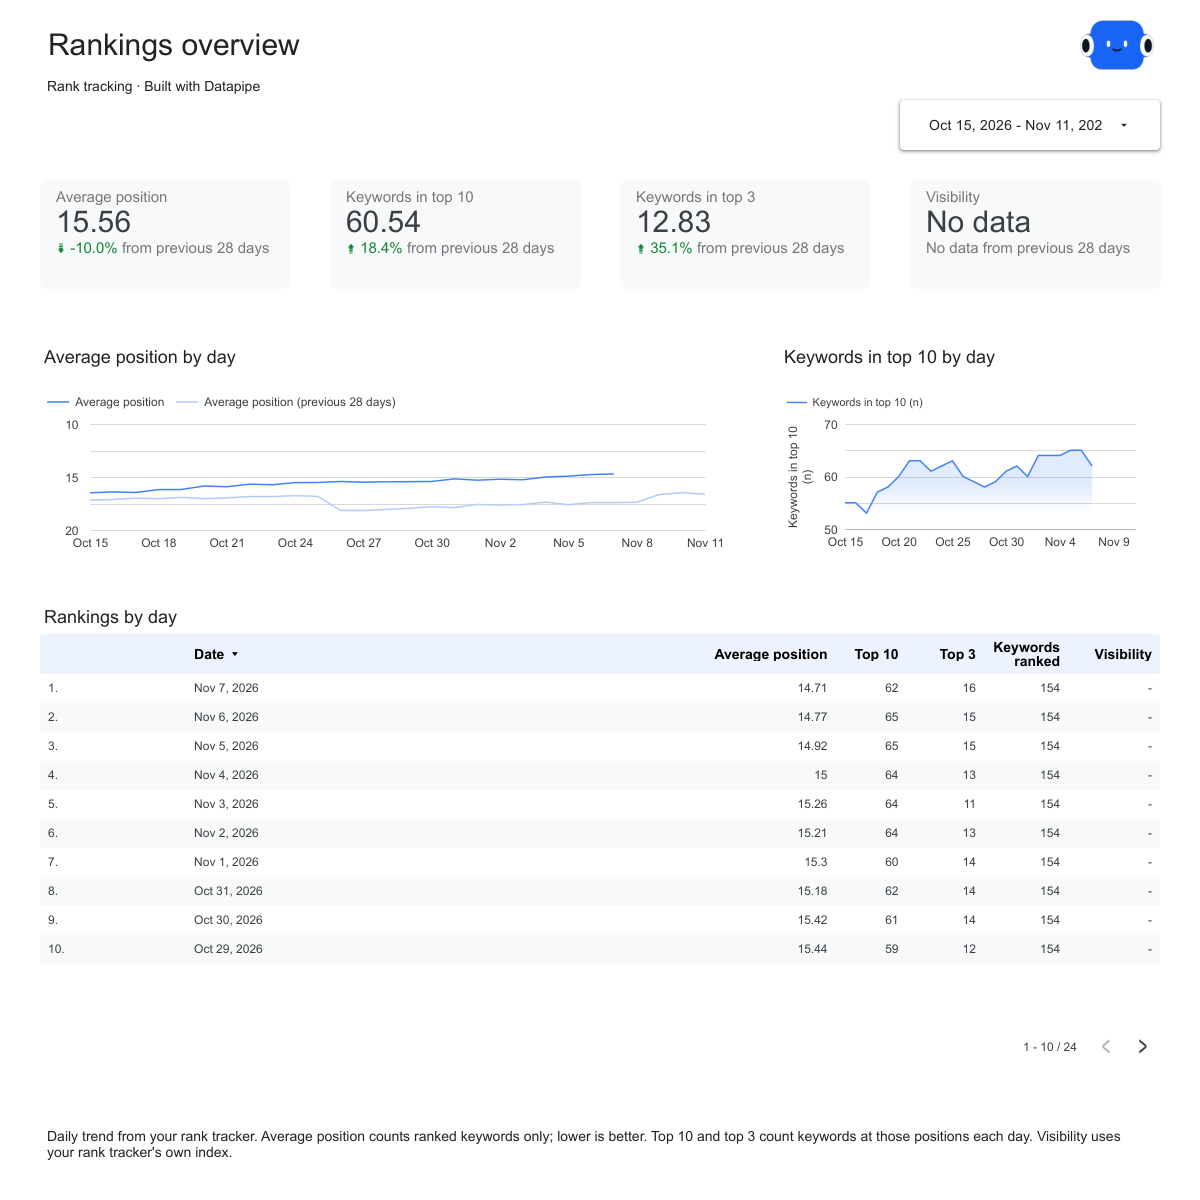
Know where you rank. See what moved.

Average position and first-page keywords by day, every tracked keyword with its change, and the keywords that moved most. One editable report filled from PageOptimized.

A Google account is needed to save a copy.

Explore the report

Choose a page to see its charts and metrics.

Choose a report page to preview
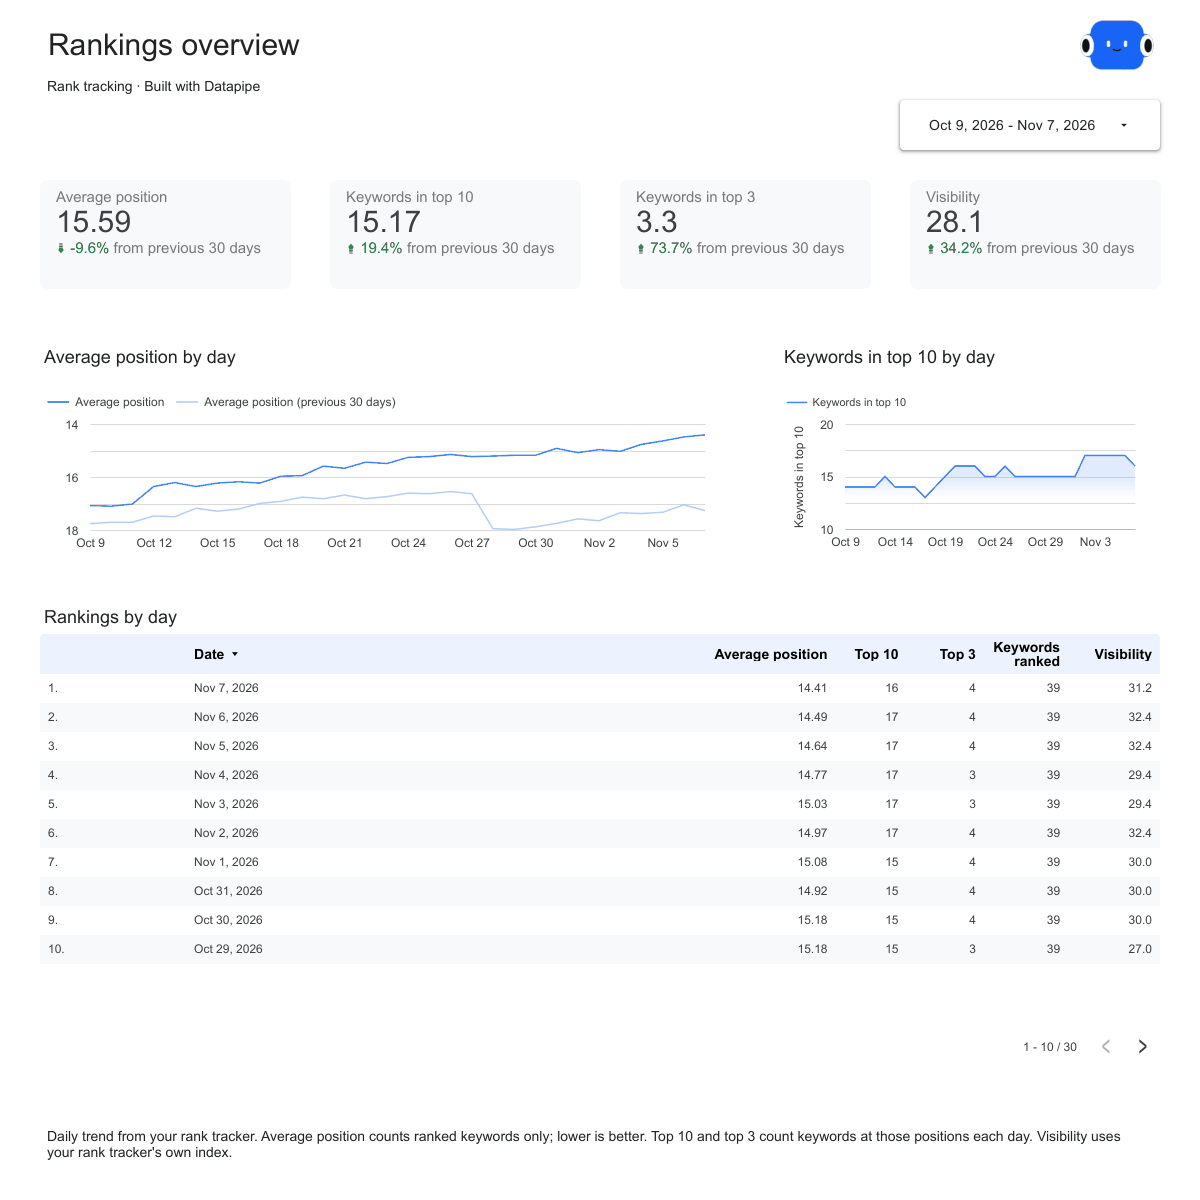
PageOptimized overview report page.
See how rankings moved. Open this page ↗
PageOptimized keywords report page.
Check every tracked keyword. Open this page ↗
PageOptimized movers report page.
Find what gained and what slipped. Open this page ↗
PageOptimized start here report page.
Your reporting guide. Open this page ↗

Open interactive report ↗ · Download PDF · CSV

Make this report yours

  1. Preview the report

    Explore the pages, charts and filters.

  2. Save a free copy

    Add your logo and adjust the layout for your team or clients.

  3. Connect your account

    Choose the account you want this dashboard to report on.

Keep your dashboard up to date

Connect PageOptimized. Datapipe updates the Google Sheet behind your dashboard on your schedule.

PageOptimizedSelected account
DatapipePrepare & refresh
Google SheetsPrivate report data
Data StudioYour dashboard

Setup, pricing and metrics

What does this PageOptimized rank tracking report include?

Four pages: Start here, Overview, Keywords and Movers. Overview shows average position, keywords in the top 10 and top 3, and visibility by day against the previous period. Keywords lists every tracked keyword with its position, previous check, change, best position and monthly searches. Movers ranks the keywords that gained or lost the most places.

How do I use this template with my PageOptimized account?

Add PageOptimized as a data source in Datapipe with your PageOptimized API key, and choose the project if your key covers more than one. Then create this dashboard and authorize Google Sheets separately. Datapipe prepares two worksheets, Keywords and Daily trend, and a copy link that replaces both report sources. Save your private Data Studio report; scheduled exports update the same workbook.

Which numbers come from PageOptimized?

PageOptimized checks each keyword separately on every search engine and device you track, so each check is its own row, named with its engine and device (for example “raised garden bed kit · Bing mobile”), with its latest position, PageOptimized’s previous check, ranking URL and best position. Monthly searches is PageOptimized’s estimate per keyword and appears once per keyword, so totals count it once. The daily trend counts every check of the day together. Reading never starts a new check, so the dashboard shows what PageOptimized last stored. Visibility stays empty.

How is average position calculated?

Only keywords that rank within the tracked depth count. Keywords that are not ranked are left out rather than counted as a high number, so they don’t make the average look worse. Lower is better.

What does Change mean?

Change is the previous position minus the latest position. A keyword that moved from 8 to 5 shows +3. Keywords that are new, lost or have no earlier check show no change value and appear in the movement chart instead.

How much history does the dashboard read?

Up to the last 90 days. The dashboard opens on the last 28 days, ending yesterday, compared with the 28 days before that. Keywords and Movers show each keyword’s latest check.

Is this the same as average position in Google Search Console?

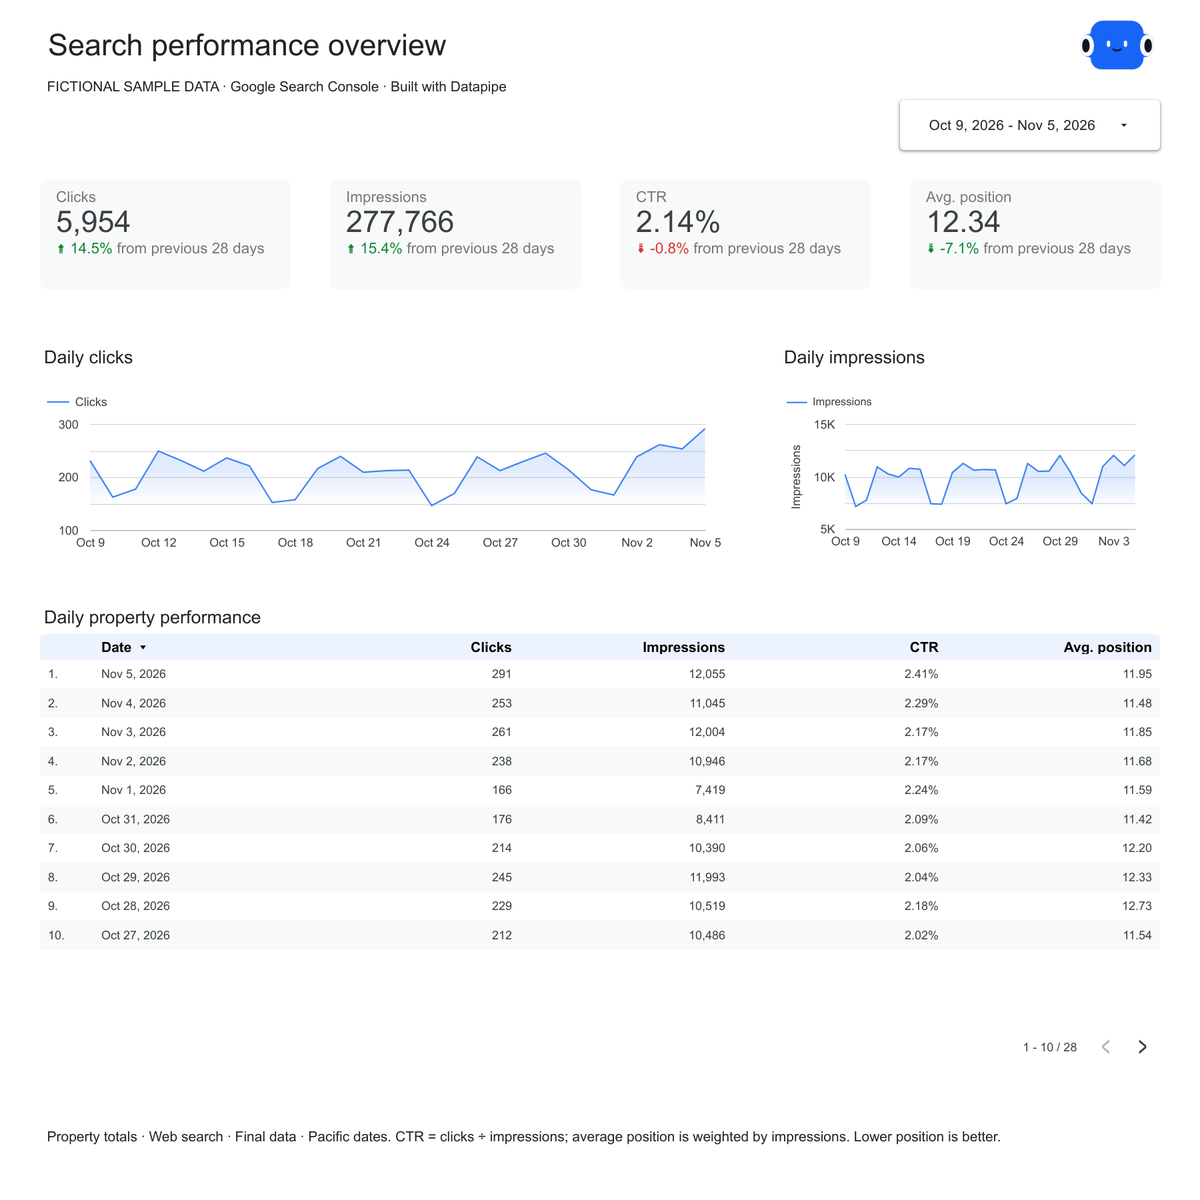
No. A rank tracker checks the keywords you chose in a set market and records the position it finds. Search Console averages the position of your site across all searches where it appeared. The two answer different questions, so the numbers differ.

Is the report template free?

The template, editable Data Studio copy, PDF and CSV are free. You need a Google account to save a copy. Datapipe plans apply when you connect and refresh your own data.

Make it your next report.