
Plausible vs Fathom vs Matomo for client reporting
Which privacy-friendly analytics tool fits each kind of client, what each one is missing, and how to report on Plausible, Fathom or Matomo in one monthly report.

For client reporting, pick Plausible when clients need a simple traffic and goals picture they can read without training. Pick Fathom when you run many small client sites under one account. Pick Matomo when a client needs ecommerce, funnels and segments, or wants the data on their own server. All three skip the setup work Google Analytics demands. And all three can feed the same monthly report in Datapipe.
This comparison covers how each tool counts, what it costs to run per client, what each one is missing, and how to report on any of them with copy-ready prompts for Claude or ChatGPT.
Plausible, Fathom and Matomo at a glance
| Plausible | Fathom | Matomo | |
|---|---|---|---|
| Best for | Clear dashboards for small and mid-size sites | Agencies running many client sites | Clients who need depth or self-hosting |
| How you run it | Hosted in the EU, or run the open-source code yourself | Hosted service | Matomo Cloud, or free On-Premise on your own server |
| Cookies | None | No cookie banner needed | Cookies by default, can be set up without them |
| Pricing model | By monthly pageviews, 30-day trial without a card | By monthly pageviews across all sites, at least 50 sites per plan | Cloud by monthly hits; On-Premise free, paid plugin bundles |
| Depth | Traffic, sources, pages, campaigns, goals, funnels | Traffic, sources, pages, events, AI referrers | Full analytics: goals, ecommerce, funnels, segments, heatmaps with plugins |
| In Datapipe | 80 report fields across 11 datasets, hosted plausible.io only | 73 report fields across 13 datasets | 166 report fields across 16 datasets, Cloud or self-hosted |
Plausible: the clearest dashboard
Verdict: the one to hand a client who wants to see their traffic without a lesson.
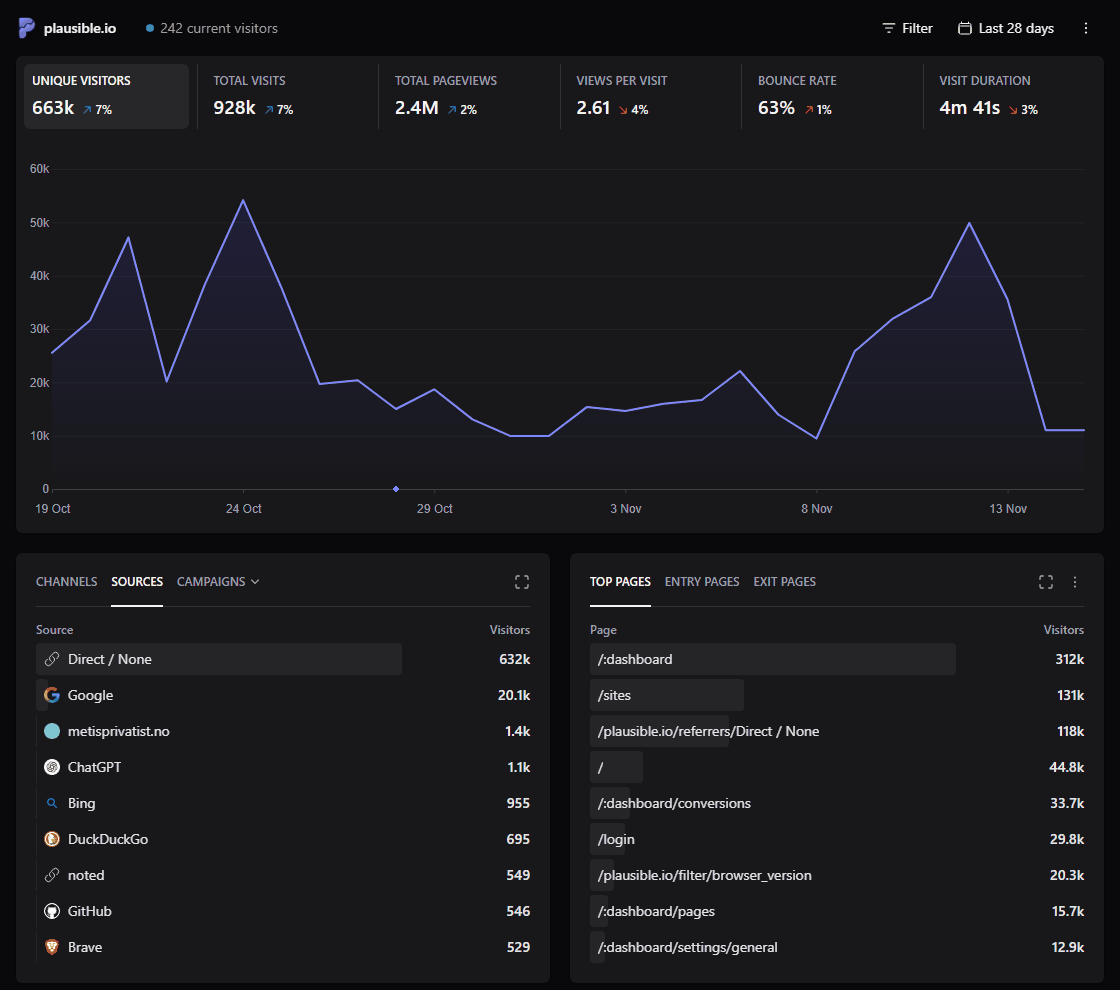
Plausible shows everything on one page: unique visitors, visits, pageviews, views per visit, bounce rate and visit duration, then sources, pages, locations and devices underneath. Clients get it on first look. That matters more than any feature when they read the report alone. Plausible prices by monthly pageviews, is made and hosted in the EU, uses no cookies, and offers a 30-day trial without a card.
Standout: goals and campaigns fit the same simple layout, so a client sees conversions next to the traffic that produced them.
Limitation: Plausible keeps analysis shallow on purpose: no heatmaps, session recordings or per-visitor paths. The API key also depends on the plan. And on which team owns the site. Datapipe also reads hosted Plausible only, not a self-hosted install.
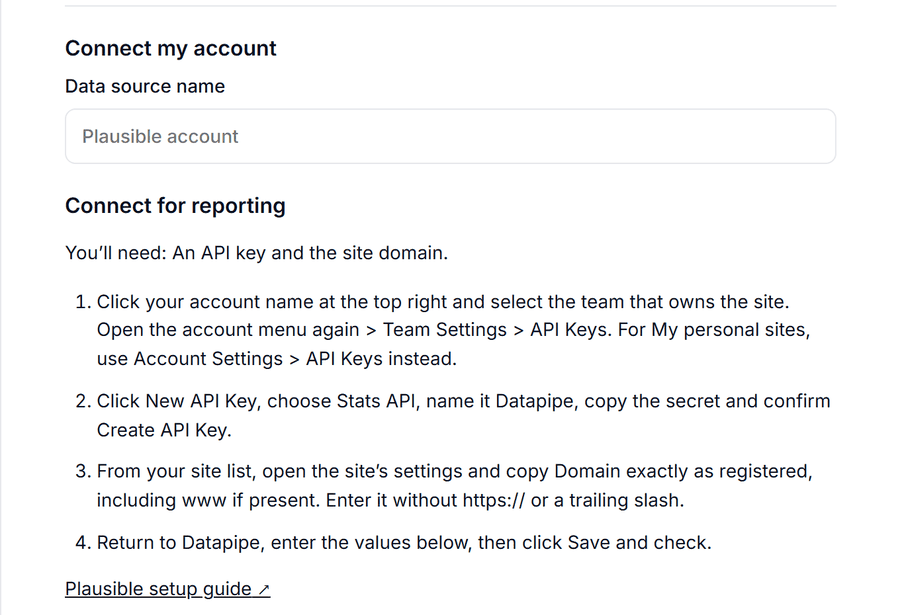
Reporting it in Datapipe: the Plausible data source reads daily and hourly traffic, pages, sources, campaigns and goal conversions. Paste a Stats API key and the site's domain exactly as Plausible shows it.
Fathom: built for many sites
Verdict: the cheapest way to cover a long list of small client sites with one account.
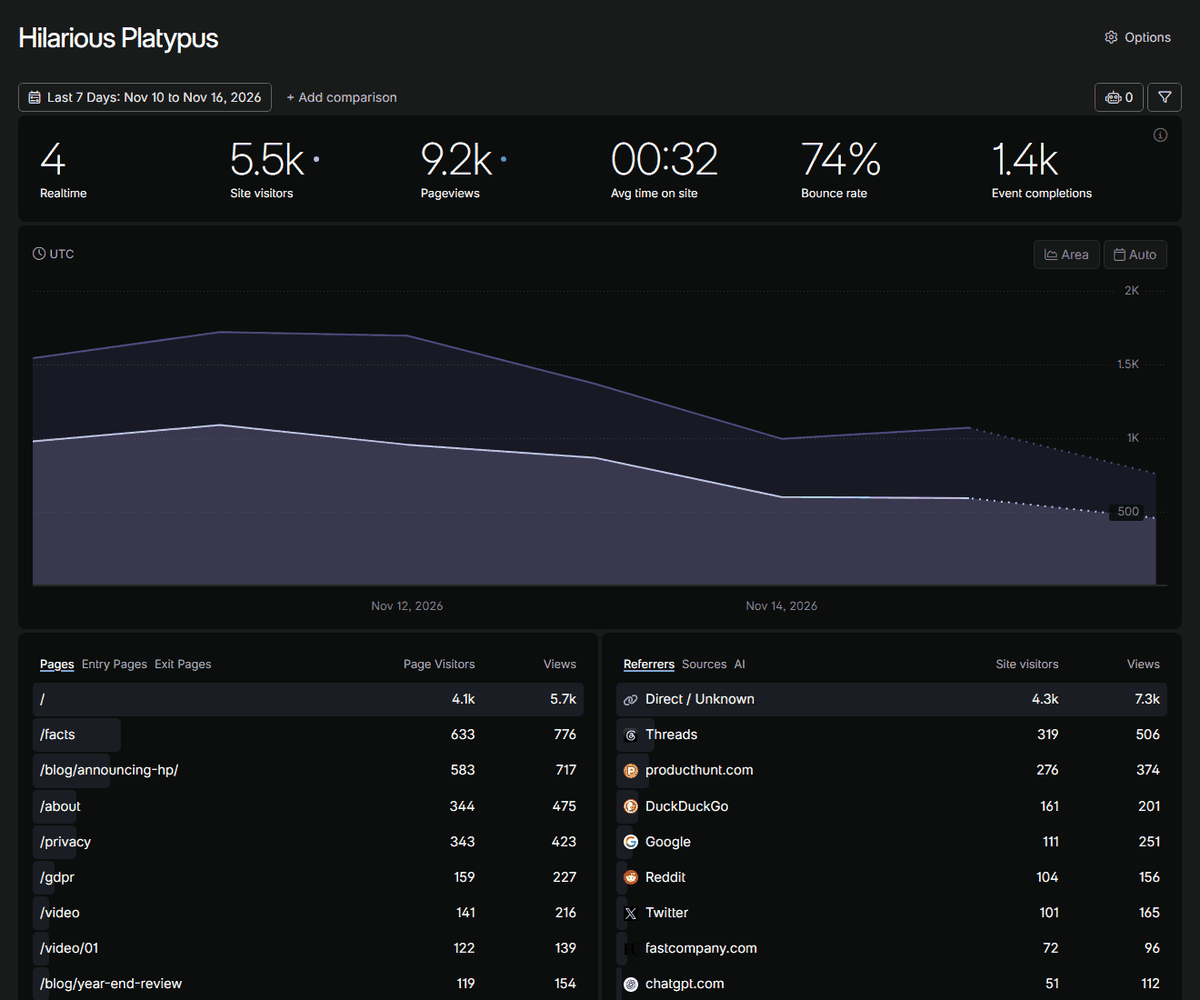
Fathom prices by pageviews across every site in the account, and every plan includes at least 50 sites. Got dozens of brochure sites? That's the reason to choose it. The dashboard shows realtime visitors, site visitors, pageviews, time on site, bounce rate and event completions across the top, with pages, entry and exit pages, referrers, sources and a separate view of visits from AI assistants underneath, all on a single screen.
Standout: AI referrers. Fathom separates visits from AI assistants. Datapipe reads them as their own dataset, Traffic by AI source.
Limitation: Fathom is a hosted service with no self-hosted option, and its API requests count toward the account's monthly pageview allowance. Grouped results in Datapipe stop at 1,000 rows. Past that you get an error, not a partial table.
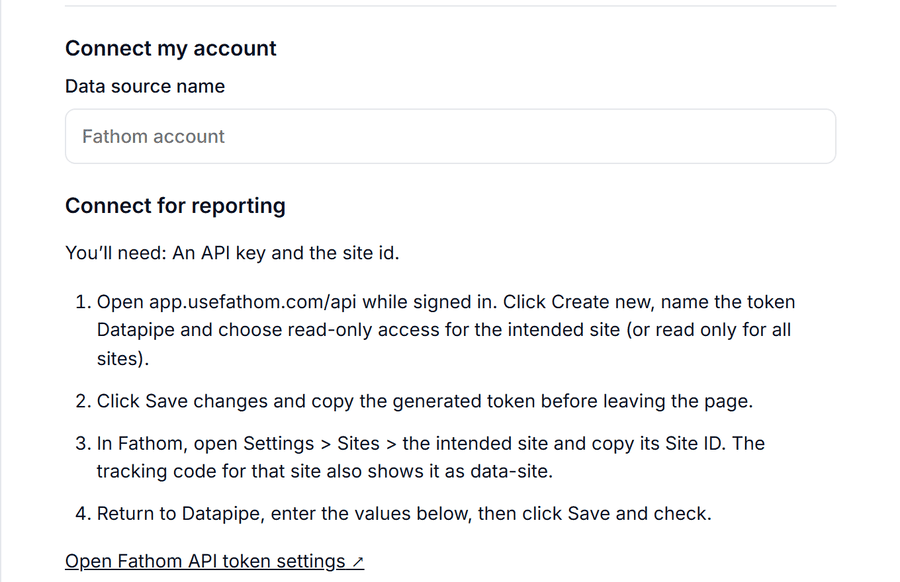
Reporting it in Datapipe: the Fathom data source reads visits, daily and monthly traffic, and traffic by page, source, country, browser, device, entry page, exit page and AI source, plus event conversions. Create a read-only API token for the site and paste it with the site ID.
Matomo: the full analytics suite
Verdict: the closest of the three to Google Analytics, and the only one you can run entirely on your own server.
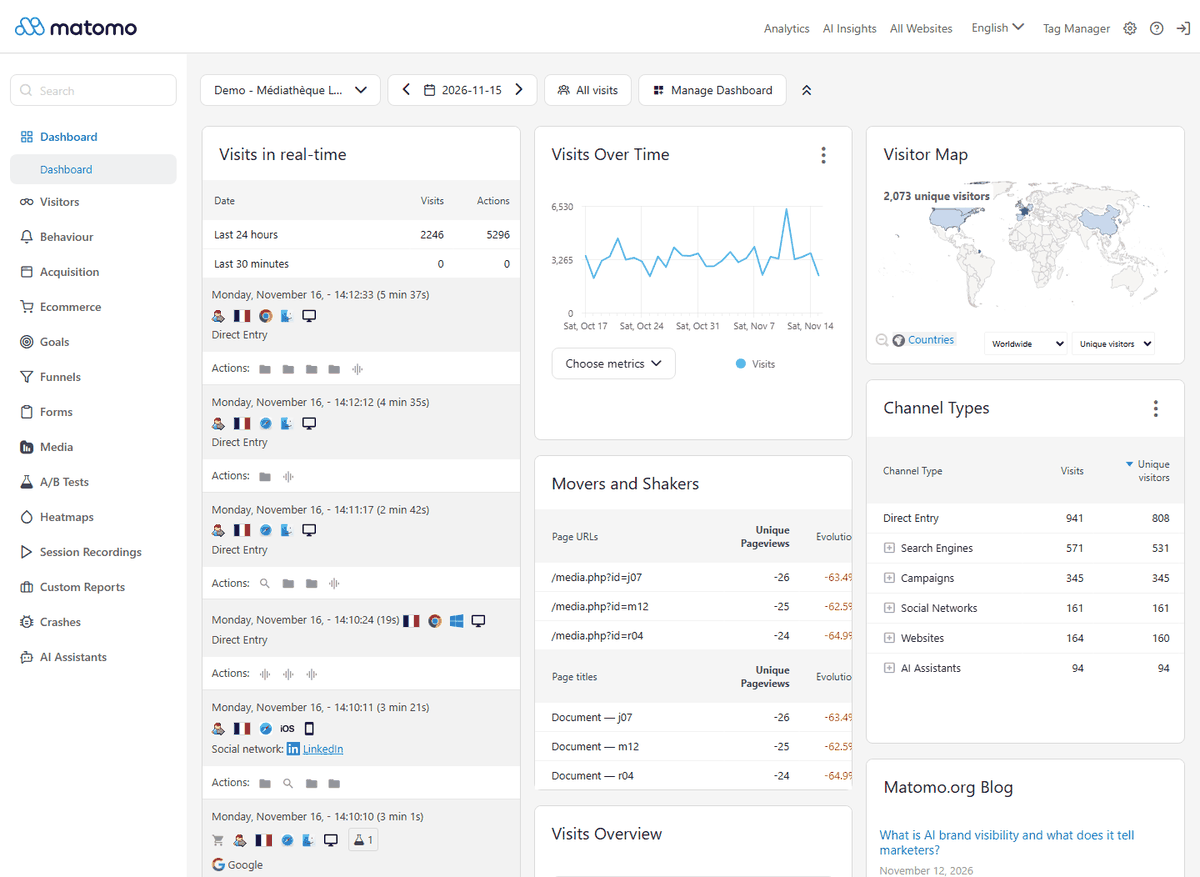
Matomo covers visitors, behaviour, acquisition, ecommerce, goals, funnels and forms, and adds heatmaps, session recordings and A/B tests through plugins. Matomo Cloud is priced by monthly hits. On-Premise is free to run on your own server, with paid bundles for the premium plugins. That's the option for a client whose legal team wants the data on infrastructure they control, inside their own network, under their own retention rules and backups, with no analytics vendor holding a copy.
Standout: segments and ecommerce. You can answer "how did returning mobile visitors from the spring campaign convert?" without exporting anything.
Limitation: effort. Someone has to run the server or pay for Cloud, keep plugins updated and learn a busy interface. For a five-page site that's overkill. Self-hosted installs behind a firewall also need to let Datapipe's server address through.
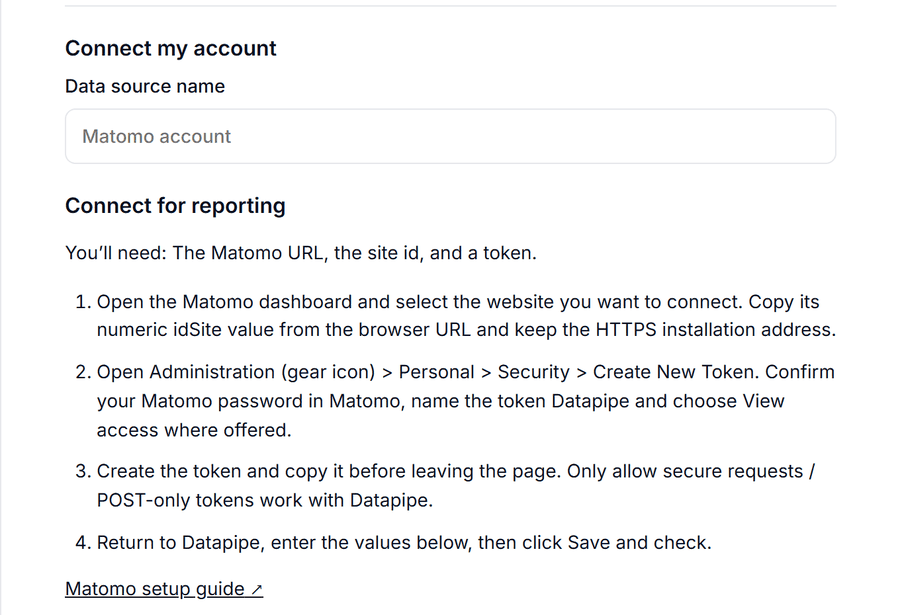
Reporting it in Datapipe: the Matomo data source reads visits, pages, channels, campaigns, devices and goal conversions in the site's time zone, from Matomo Cloud or your own server. Paste your Matomo address, the site ID and an auth token.
What a client report needs from any of them
The tool changes. The questions don't. Map each one to the fields all three provide.
| Question | Metric | Watch out for |
|---|---|---|
| How many people came? | Unique visitors | Never add unique visitors across days or pages; the same person counts once per row |
| How much did they look at? | Visits and pageviews | Pageviews include repeat views of one page |
| Where did they come from? | Sources or referrers, and campaigns for tagged links | Untagged email and social traffic often shows as direct |
| Did they do what the site is for? | Goal conversions or event completions | Only goals you set up are counted, from the day you set them up |
| Is it better or worse than last month? | The same metrics for the previous period | Compare complete months, in the site's time zone |
Here's the stance: if a client's site exists to get enquiries, the report leads with goal conversions, whatever tool counts them. Traffic is context.
How to report on any of them in Datapipe
- Open Data sources, choose Add data source and pick the tool. Paste the key and site details shown in its panel, then click Save and check.
- Open Reports and add a report for the data source. Pick a dataset, such as Daily traffic or Goal conversions, choose the columns and where it goes: Google Sheets, Data Studio or another destination.
- On the report's page, open Schedule & send, set the refresh and add the client's email.
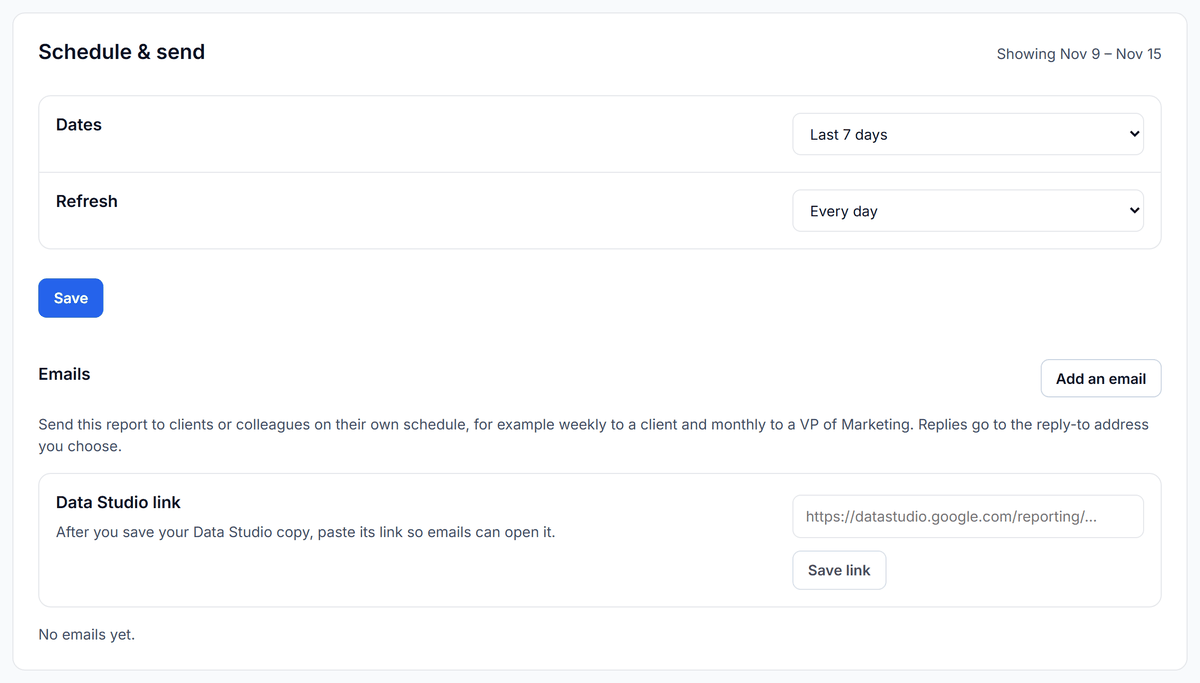
Free and Starter refresh daily, Pro hourly, and Agency every 15 minutes on up to 50 data sources, as listed on the Datapipe pricing page. Add Search Console to the same project when you want search queries next to the traffic; our guide to the SEO metrics to report to clients covers which ones belong in the report.
A worked example
For example, take an agency with 30 small service-business clients and one online shop.
- The 30 service sites go on Fathom. One account covers them, since every plan includes at least 50 sites, and each site gets a goal for the contact form. The monthly report shows site visitors, top sources and form completions.
- The shop goes on Matomo Cloud. It needs ecommerce reports, segments and heatmaps in one place, so the agency can see which visitors abandon checkout and what they did on the page first.
- A client who asks for the simplest possible view gets Plausible. The owner opens one page and sees visitors, sources and goals without scrolling through menus.
Datapipe reads all three. Same layout, same email, same day, whatever tool sits underneath.
Ask Claude or ChatGPT for the monthly summary
With the tool added to a Datapipe project and the project connected to Claude or ChatGPT (Settings, then Claude / ChatGPT in Datapipe), these prompts write the summary from live numbers.
Read last month's traffic and goals.
In [project name], read [Plausible, Fathom or Matomo] for [month start] to [month end] and for the month before: visitors, visits, pageviews, bounce rate and goal conversions, plus the top 10 sources and top 10 pages by visitors. Don't add unique visitors across rows. Don't change anything.
Find what changed.
In [project name], compare the two months from your last answer. List the sources and pages with the biggest change in visitors and the goals with the biggest change in conversions, with numbers before and after. Don't change anything.
Write the client note.
Using only the numbers from your last two answers, write a short monthly note for the client. Lead with goal conversions, then visitors and the main sources, and end with one thing to improve next month. Don't change anything.
Which one should you pick?
If the client needs a dashboard they'll read on their own, pick Plausible. Many small sites, one bill? Fathom. If the client sells online, needs funnels or segments, or wants the data on their own server, pick Matomo. And if the client is already on one of them and happy, keep it: switching tools resets the history you compare against.
Troubleshooting Plausible, Fathom and Matomo reports
If Plausible won't connect, check the key type and owner. The key needs Stats API access, and a key from your personal team can't read a client site owned by another team. Ask that team's administrator for a key.
If your Plausible is self-hosted, Datapipe can't read it. Datapipe connects to hosted plausible.io only.
If a Fathom report shows an error instead of a table, the grouped result passed 1,000 rows. Shorten the date range or choose a narrower breakdown.
If Matomo says it can't be reached, a firewall or security tool on your server is blocking Datapipe. Allow Datapipe's server address, shown in the Matomo setup panel, then save again.
If Matomo rates look tiny, they're fractions. 0.25 means 25%. Format the column as a percentage in your sheet or dashboard.
If unique visitors don't match the tool's dashboard, someone added them across days or pages. Read the total for the whole period instead of summing rows.
Frequently asked questions
Which is better for agencies, Plausible or Fathom?
Fathom suits agencies with many small client sites, because every plan includes at least 50 sites billed on shared pageviews. Plausible suits clients who read the dashboard themselves, since its one-page layout needs no training. Both are cookieless and both report into Datapipe.
Is Matomo free?
Matomo On-Premise is free to run on your own server, with paid bundles for premium plugins such as heatmaps and session recordings. Matomo Cloud is a paid hosted service priced by monthly hits.
Do Plausible, Fathom and Matomo need a cookie banner?
Plausible uses no cookies and Fathom says no cookie banner is needed. Matomo uses cookies by default and can be set up to track without them. Check your own legal requirements for each client.
Can I self-host Plausible and still report on it in Datapipe?
No. Datapipe reads hosted Plausible at plausible.io only. Matomo works either way: enter your own Matomo address or your Matomo Cloud address.
Why don't unique visitors add up across days?
The same person counts once in each row, so adding daily unique visitors counts them several times. Read the total for the whole period from the tool instead of summing rows.
Can Claude or ChatGPT read Plausible, Fathom or Matomo data?
Yes, through Datapipe. Add the tool to a Datapipe project, connect the project in Claude or ChatGPT from Settings, then Claude / ChatGPT, and ask in plain language. Changes such as adding goals stay off unless someone allows them.
Put your marketing numbers on autopilot
Datapipe connects your data sources and keeps your reports refreshed on a schedule.
Start free