Start free
← All report templates

SendGrid · Free Data Studio template

SendGrid report template
Check that your email arrives, and see where it gets blocked.

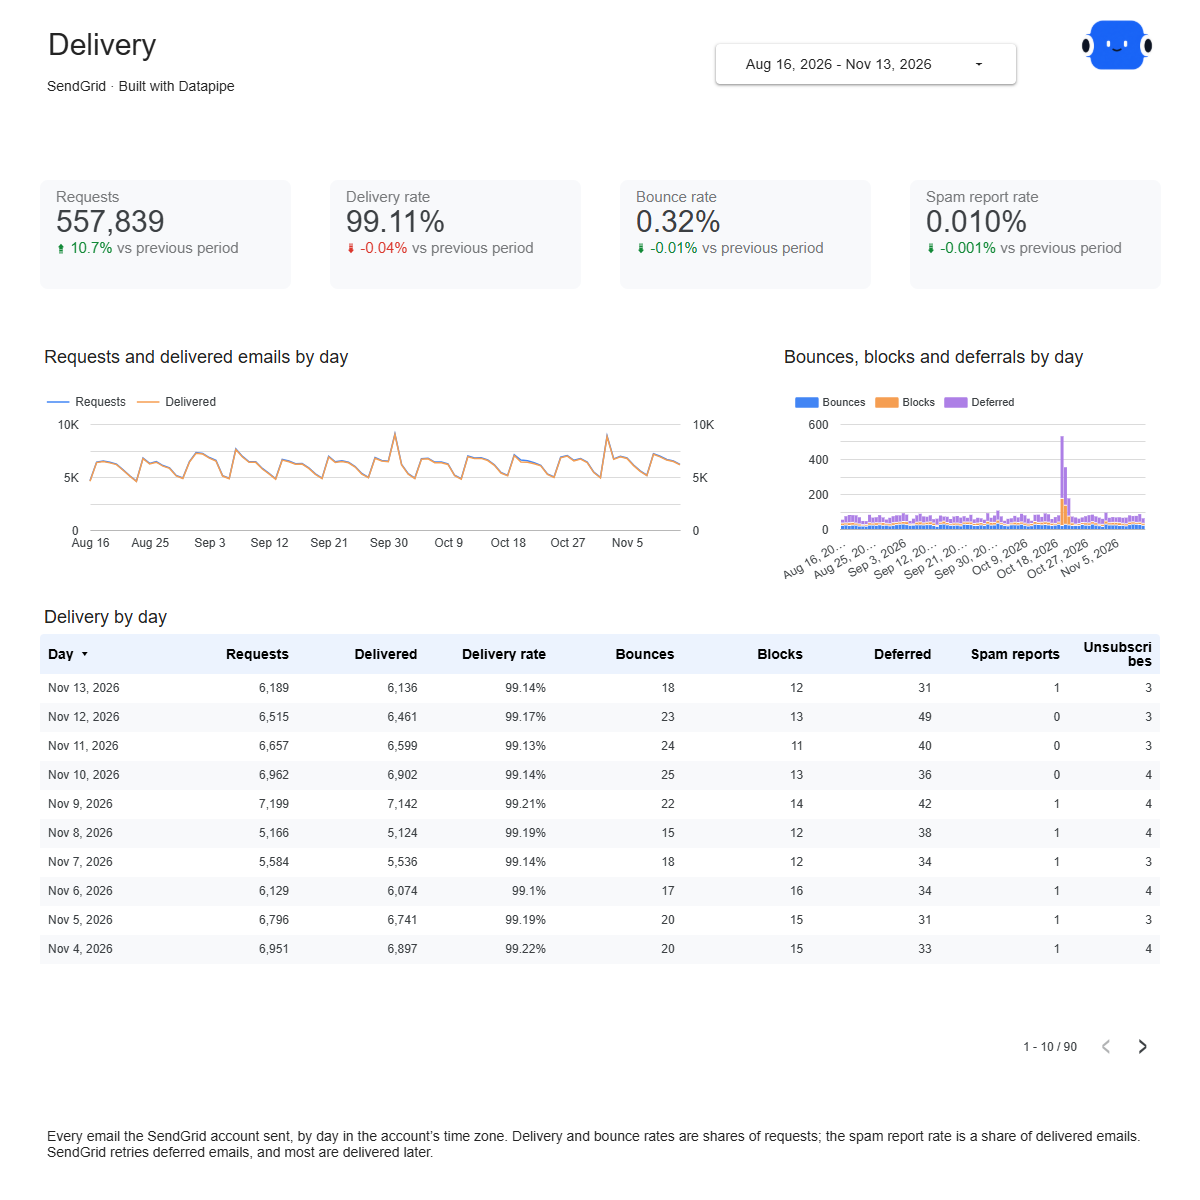
Delivery, bounce and spam report rates against the previous period, daily bounces, blocks and spam reports, delivery at each mailbox provider, and opens and clicks by device, email client and browser. One editable report for a weekly deliverability check.

A Google account is needed to save a copy.

Explore the report

Choose a page to see its charts and metrics.

Choose a report page to preview
SendGrid delivery report page.
Know your delivery rate every day. Open this page ↗
SendGrid mailbox providers report page.
Find the provider that blocks you. Open this page ↗
SendGrid engagement report page.
See who opens and clicks, and on what. Open this page ↗
SendGrid start here report page.
Your reporting guide. Open this page ↗

Open interactive report ↗ · Download PDF · CSV

Make this report yours

  1. Preview the report

    Explore the pages, charts and filters.

  2. Save a free copy

    Add your logo and adjust the layout for your team or clients.

  3. Connect your account

    Choose the account you want this dashboard to report on.

Keep your dashboard up to date

Add SendGrid with an API key that has read access to Stats, including global, mailbox provider, device, client and browser statistics. Datapipe reads your statistics by day and updates the Google Sheet behind your dashboard on your schedule.

SendGridSelected account
DatapipePrepare & refresh
Google SheetsPrivate report data
Data StudioYour dashboard

Setup, pricing and metrics

What does this SendGrid report include?

Four pages: Start here, Delivery, Engagement and Mailbox providers. Delivery shows requests, delivered emails, bounces, blocks, deferrals, drops and spam reports by day with delivery, bounce and spam report rates. Engagement shows opens and clicks by day, opens by device type and email client, and clicks by browser. Mailbox providers shows delivery, bounces, blocks, deferrals and spam reports at each provider.

How do I use this template with my own SendGrid account?

Add SendGrid as a data source in Datapipe with an API key that has read access to Stats, including global, mailbox provider, device, client and browser statistics. Then create this dashboard and authorize Google Sheets separately. Datapipe reads your statistics, prepares three worksheets and your private Data Studio copy; scheduled refreshes update the same workbook.

How do the comparisons work?

Each card compares the dates you pick with the same number of days just before them. To fill those cards, each refresh reads twice the date range from SendGrid, so a 90-day dashboard reads 180 days of statistics.

Which days are included?

SendGrid builds each day in your account’s time zone. Each refresh reads the date range up to yesterday, so the newest day may still be adding up for accounts west of UTC.

How are the rates worked out?

Delivery rate and bounce rate divide delivered emails and bounces by requests. Open rate, click rate and spam report rate divide unique opens, unique clicks and spam reports by delivered emails. The totals on each page divide the combined counts, so a busy day counts more than a quiet one.

What is the difference between a bounce, a block and a deferral?

A bounce is an email the receiving server rejected, often because the address does not exist. A block is an email the mailbox provider refused, usually because of your sending reputation or content. A deferral is an email the provider asked SendGrid to try again later; most deferred emails are delivered on a later attempt.

Why don’t unique opens add up across days?

SendGrid counts a unique open once per day, so a recipient who opens on two days counts on both days.

Is the template free?

The template, PDF and CSV are free. Datapipe plans apply to automatic refreshes for your account.

Make it your next report.