Start free
← All report templates

Plausible · Free Data Studio template

Plausible report template
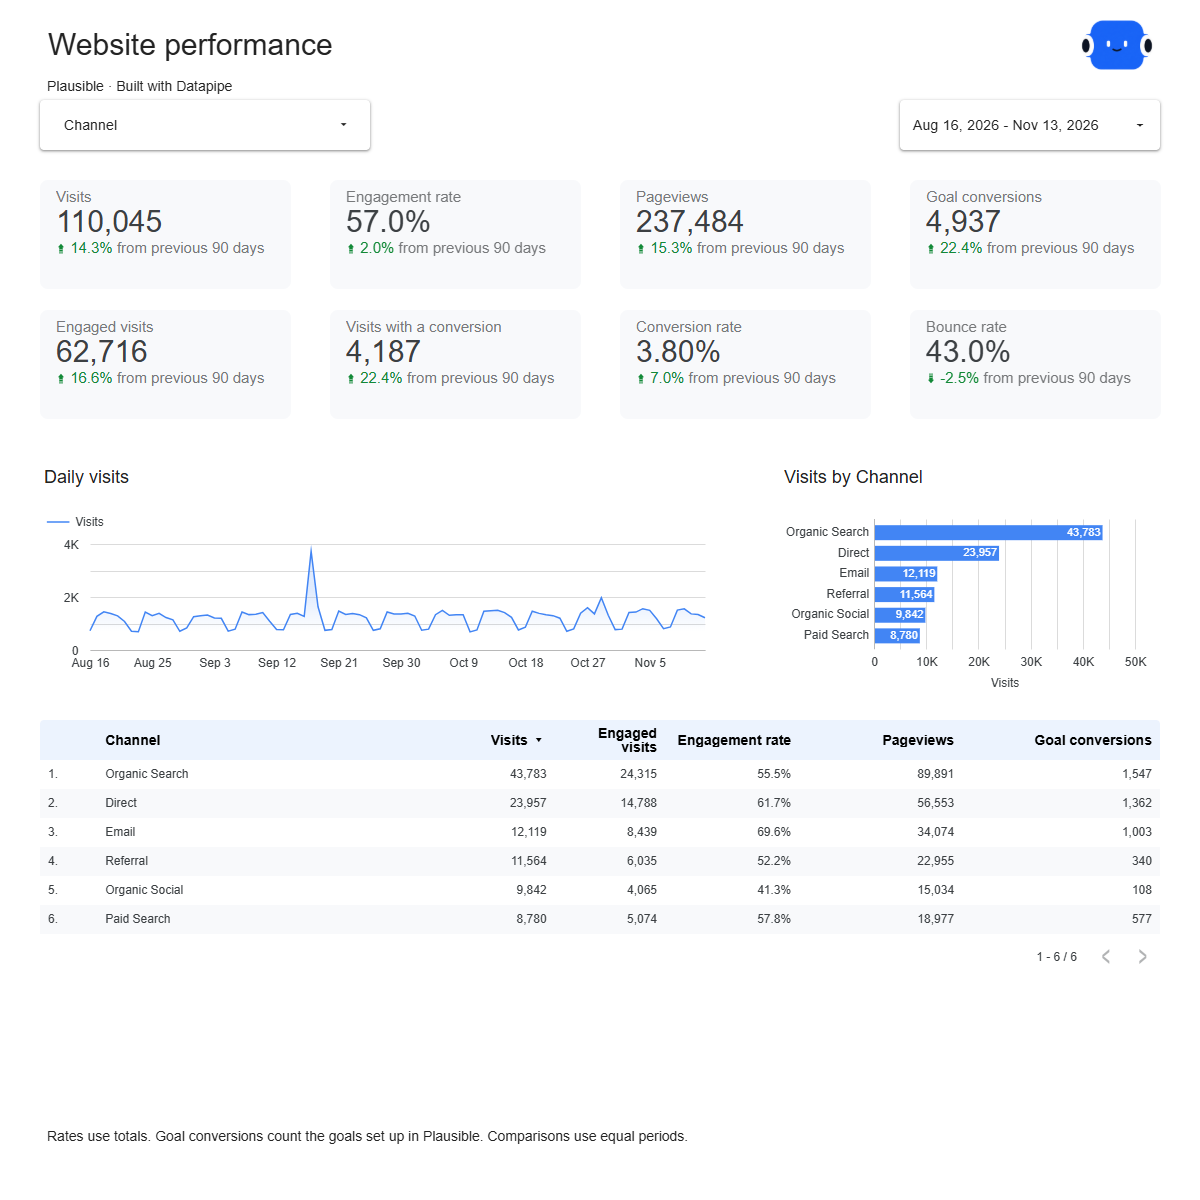
See where visits come from, which pages they read and which goals they reach.

Visits, pageviews, bounce rate and goal conversions against the previous period, by channel, source, campaign, entry page, page and device. One editable report for a monthly website review.

A Google account is needed to save a copy.

Explore the report

Choose a page to see its charts and metrics.

Choose a report page to preview
Plausible overview report page.
Know how the site is doing. Open this page ↗
Plausible acquisition report page.
See which sources bring visits that convert. Open this page ↗
Plausible entry pages report page.
Find the pages that start good visits. Open this page ↗
Plausible content report page.
Learn what people read. Open this page ↗
Plausible engagement & goals report page.
Check engagement by device and each goal. Open this page ↗
Plausible start here report page.
Your reporting guide. Open this page ↗

Open interactive report ↗ · Download PDF · CSV

Make this report yours

  1. Preview the report

    Explore the pages, charts and filters.

  2. Save a free copy

    Add your logo and adjust the layout for your team or clients.

  3. Connect your account

    Choose the account you want this dashboard to report on.

Keep your dashboard up to date

Add Plausible with a Stats API key and choose your site. Datapipe reads your site’s traffic and goal conversions and keeps your dashboard up to date on your schedule.

PlausibleSelected account
DatapipePrepare & refresh
Google SheetsPrivate report data
Data StudioYour dashboard

Setup, pricing and metrics

What does this Plausible report include?

Six pages: Start here, Overview, Acquisition, Entry pages, Content and Engagement & goals. Overview compares visits, engagement rate, pageviews, goal conversions, conversion rate and bounce rate with the previous period. Acquisition breaks visits down by source and campaign, Entry pages by the first page of each visit, Content by every page viewed, and Engagement & goals by device and goal.

How do I use this template with my own Plausible site?

Add Plausible as a data source in Datapipe with a Stats API key, then choose your site. Choose this template in Reports and Datapipe reads your site’s traffic and goals and opens your filled Data Studio copy. Scheduled refreshes keep it up to date.

What is an engaged visit?

A visit that did not bounce. Plausible reports a bounce rate rather than engaged visits, so the report works them out as visits minus bounced visits. Engagement rate is engaged visits divided by visits, and bounce rate is the rest.

Why aren’t unique visitors shown?

Unique visitors can’t be added up across days or pages without counting some people twice, so the report uses visits and pageviews, which add up correctly for any date range or filter.

How are goal conversions counted?

Each completion of a goal you set up in Plausible counts once. Visits with a conversion count visits that completed at least one goal, and conversion rate divides them by all visits. Sites without goals show zero conversions.

How do the comparisons work?

Each card compares the dates you pick with the same number of days just before them. To fill those cards, each refresh reads the earlier period as well, in your site’s time zone in Plausible.

Is the template free?

The template, PDF and CSV are free. Datapipe plans apply to automatic refreshes for your account.

Make it your next report.