Start free
← All report templates

Google Tag Manager · Free Data Studio template

Google Tag Manager report template
Know what your container runs before you publish.

Every live tag with its triggers and consent setting, paused tags, unused triggers, variables, version history and the changes waiting in workspaces. One editable report for a container audit.

A Google account is needed to save a copy.

Explore the report

Choose a page to see its charts and metrics.

Choose a report page to preview
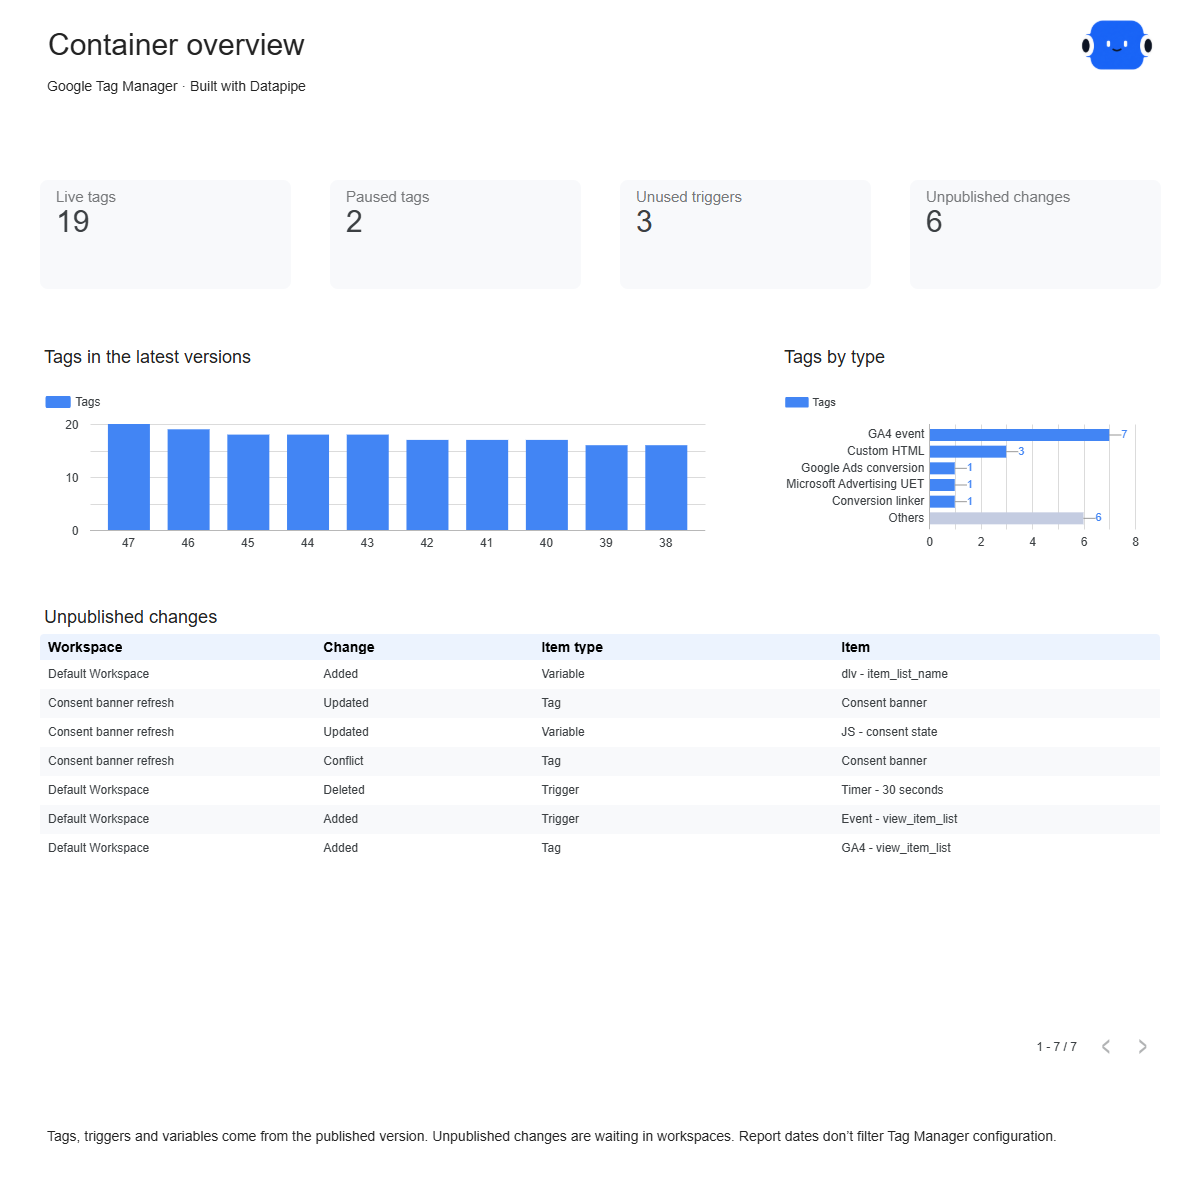
Google Tag Manager overview report page.
See what the container runs. Open this page ↗
Google Tag Manager tags report page.
Check every live tag. Open this page ↗
Google Tag Manager triggers & variables report page.
Find what no tag uses. Open this page ↗
Google Tag Manager start here report page.
Your reporting guide. Open this page ↗

Open interactive report ↗ · Download PDF · CSV

Make this report yours

  1. Preview the report

    Explore the pages, charts and filters.

  2. Save a free copy

    Add your logo and adjust the layout for your team or clients.

  3. Connect your account

    Choose the account you want this dashboard to report on.

Keep your dashboard up to date

Connect your Tag Manager container. Datapipe updates the Google Sheet behind your dashboard on your schedule.

Google Tag ManagerSelected account
DatapipePrepare & refresh
Google SheetsPrivate report data
Data StudioYour dashboard

Setup, pricing and metrics

What does this Google Tag Manager report include?

Four pages: Start here, Overview, Tags and Triggers & variables. Overview shows live tags, paused tags, unused triggers and unpublished changes, with tags by type and the number of tags in recent versions. Tags lists every live tag with its triggers, folder and consent setting. Triggers & variables lists every trigger with how many tags use it, and variables by type.

How do I use this template with my own container?

Add Google Tag Manager as a data source in Datapipe with a Google account that can read the container, and choose the container. Then create this dashboard and authorize Google Sheets separately. Datapipe prepares five worksheets and your private Data Studio copy; scheduled refreshes update the same workbook.

Does the date range change the numbers?

No. Tag Manager holds configuration, not traffic, so the report shows the container as it was when Datapipe last read it. The read date is on every page.

Which version does the report show?

Tags, triggers and variables come from the published (live) version. Version history lists every saved version that wasn’t deleted, and Unpublished changes lists what workspaces have added, updated or deleted since.

What counts as an unused trigger?

A trigger in the live version that no live tag uses to fire or to block. Built-in triggers such as All Pages are not listed as triggers.

Can Datapipe change my container?

No. Datapipe reads Tag Manager with read-only access. It never creates, edits or publishes anything.

Does it cover several containers?

One container per dashboard. Add each container as its own data source and create a dashboard for each.

Is the template free?

The template, PDF and CSV are free. Datapipe plans apply to automatic refreshes from your container.

Make it your next report.