Start free
← All report templates

GitHub · Free Data Studio template

GitHub report template
See what shipped. Spot what slows the team down.

Commits and contributors, pull requests with time to merge, and every GitHub Actions run with its result, compared with the previous period. One editable report for a regular engineering review.

A Google account is needed to save a copy.

Explore the report

Choose a page to see its charts and metrics.

Choose a report page to preview
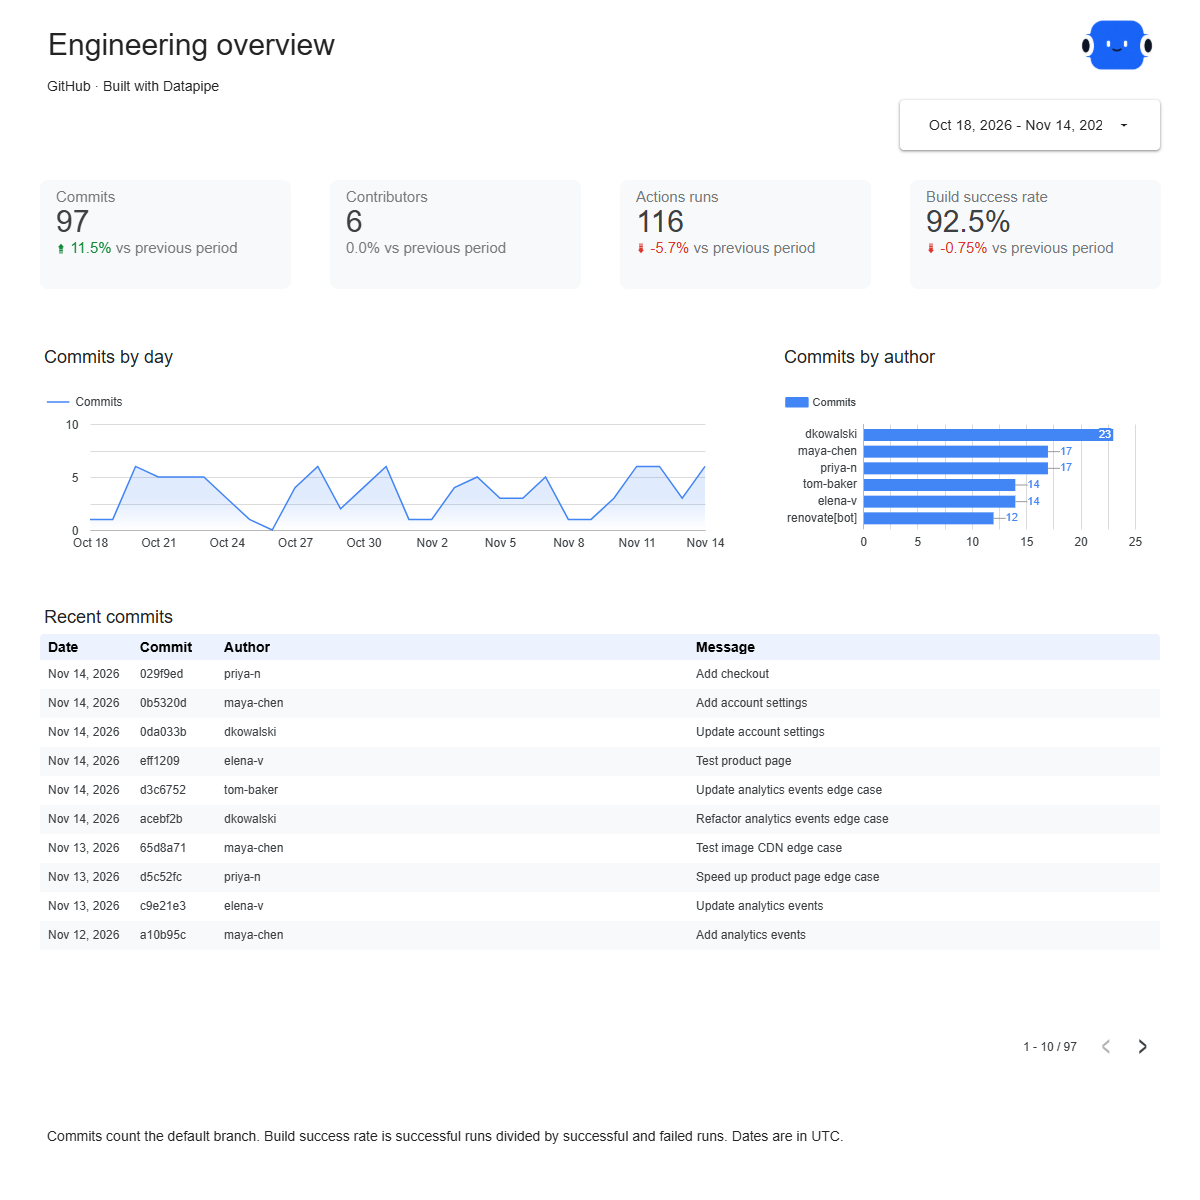
GitHub overview report page.
See what shipped. Open this page ↗
GitHub pull requests report page.
Know how long reviews take. Open this page ↗
GitHub actions runs report page.
Catch failing builds. Open this page ↗
GitHub start here report page.
Your reporting guide. Open this page ↗

Open interactive report ↗ · Download PDF · CSV

Make this report yours

  1. Preview the report

    Explore the pages, charts and filters.

  2. Save a free copy

    Add your logo and adjust the layout for your team or clients.

  3. Connect your account

    Choose the account you want this dashboard to report on.

Keep your dashboard up to date

Connect your GitHub repository. Datapipe updates the Google Sheet behind your dashboard on your schedule.

GitHubSelected account
DatapipePrepare & refresh
Google SheetsPrivate report data
Data StudioYour dashboard

Setup, pricing and metrics

What does this GitHub report include?

Four pages: Start here, Overview, Pull requests and Actions runs. Overview shows commits, contributors, GitHub Actions runs and build success rate against the previous period, with commits by day. Pull requests lists every pull request opened in the dates with its state and hours to merge. Actions runs shows each GitHub Actions run with its result and minutes.

How do I use this template with my own repository?

Add GitHub as a data source in Datapipe, install the Datapipe GitHub app on the repository, and choose it. Then create this dashboard and authorize Google Sheets separately. Datapipe prepares three worksheets and your private Data Studio copy; scheduled refreshes update the same workbook.

Which commits are counted?

Commits on the repository’s default branch with a commit date in the selected dates. Commits on other branches count once they reach the default branch.

How is time to merge calculated?

Hours from when a pull request was opened to when it was merged. The report shows the median, so one very slow pull request doesn’t hide the typical wait. Pull requests that aren’t merged have no time to merge.

How is the build success rate calculated?

Successful runs divided by successful and failed runs. Failed includes failure, timed out and startup failure results. Cancelled, skipped and in-progress runs are left out.

What if the repository has no pull requests?

The pull request page shows “No data”. Commits and GitHub Actions runs still fill the other pages.

Does it cover several repositories?

One repository per dashboard. Add each repository as its own data source and create a dashboard for each.

Is the template free?

The template, PDF and CSV are free. Datapipe plans apply to automatic refreshes from your repository.

Make it your next report.