Start free
← All report templates

PageSpeed Insights · Free Data Studio template

PageSpeed Insights report template
See which pages are slow, and what to fix first.

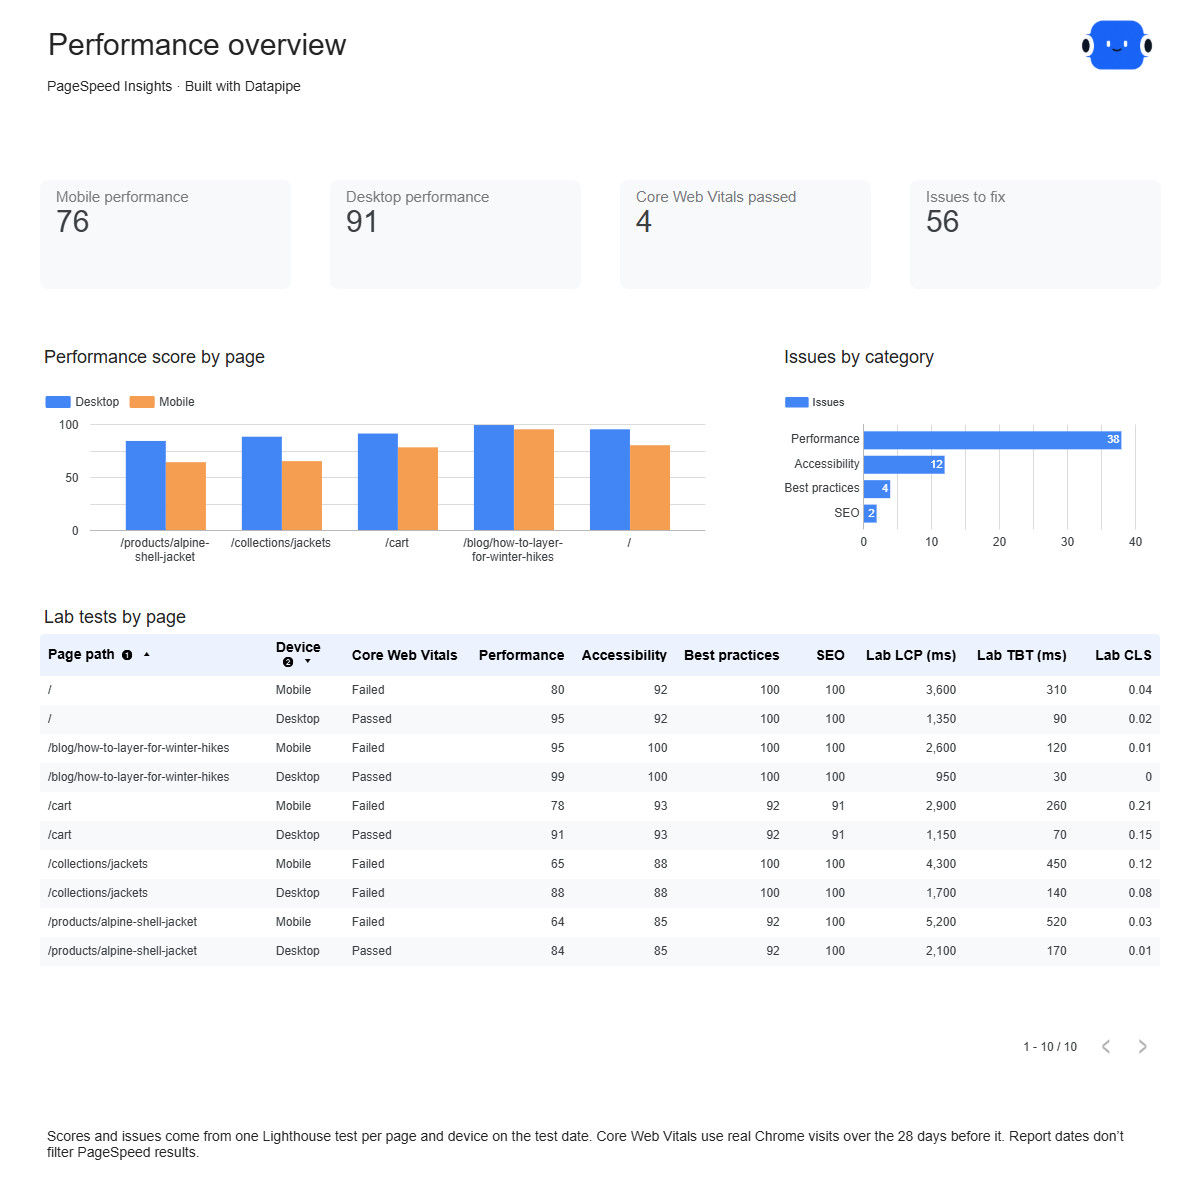
Lighthouse scores and lab metrics, Core Web Vitals from real Chrome users and every failed check with Google’s estimated savings, for each page you track on mobile and desktop. One editable report for a site speed review.

A Google account is needed to save a copy.

Explore the report

Choose a page to see its charts and metrics.

Choose a report page to preview
PageSpeed Insights overview report page.
See which pages are slow. Open this page ↗
PageSpeed Insights core web vitals report page.
Check what real visitors get. Open this page ↗
PageSpeed Insights issues to fix report page.
Fix the biggest savings first. Open this page ↗
PageSpeed Insights start here report page.
Your reporting guide. Open this page ↗

Open interactive report ↗ · Download PDF · CSV

Make this report yours

  1. Preview the report

    Explore the pages, charts and filters.

  2. Save a free copy

    Add your logo and adjust the layout for your team or clients.

  3. Connect your account

    Choose the account you want this dashboard to report on.

Keep your dashboard up to date

List the pages to test in Datapipe. Datapipe tests them on mobile and desktop and updates the Google Sheet behind your dashboard on your schedule.

PageSpeed InsightsSelected account
DatapipePrepare & refresh
Google SheetsPrivate report data
Data StudioYour dashboard

Setup, pricing and metrics

What does this PageSpeed Insights report include?

Four pages: Start here, Overview, Core Web Vitals and Issues to fix. Overview shows average Lighthouse scores for mobile and desktop and every page’s scores. Core Web Vitals shows real-user LCP, INP and CLS at the 75th percentile with the share of good, needs improvement and poor visits, next to the lab metrics. Issues to fix lists every failed Lighthouse check with Google’s estimated savings.

How do I use this template with my own pages?

Add PageSpeed Insights as a data source in Datapipe and list the pages you want to test. Then create this dashboard and authorize Google Sheets separately. Datapipe tests each page on mobile and desktop, prepares three worksheets and your private Data Studio copy; scheduled refreshes update the same workbook.

What is the difference between lab and field data?

Lab data comes from one Lighthouse test Google runs when Datapipe asks, on an emulated phone or computer. Field data comes from real Chrome users over the last 28 days. Scores and issues are lab data; the Core Web Vitals page shows field data.

Why does a page show whole-site data?

When a page has too few Chrome visits, Google returns field data for the whole site instead. The report marks those rows Whole site.

Why does a page show Not enough data?

Google needs enough Chrome visits to report LCP, INP and CLS. A page or site without enough visits has lab scores and issues but no Core Web Vitals status.

Does the date range change the numbers?

No. Each refresh tests the pages as they are that day. Field data always covers the 28 days before the test.

Why do scores change between refreshes?

Lab tests vary a little from run to run with network and server timing. Compare several refreshes before reading a small change as a trend.

Is the template free?

The template, PDF and CSV are free. Datapipe plans apply to automatic refreshes for your pages.

Make it your next report.