Datapipe
Start free
← All report templates

PageOptimized · Free Data Studio template

PageOptimized site audit report template
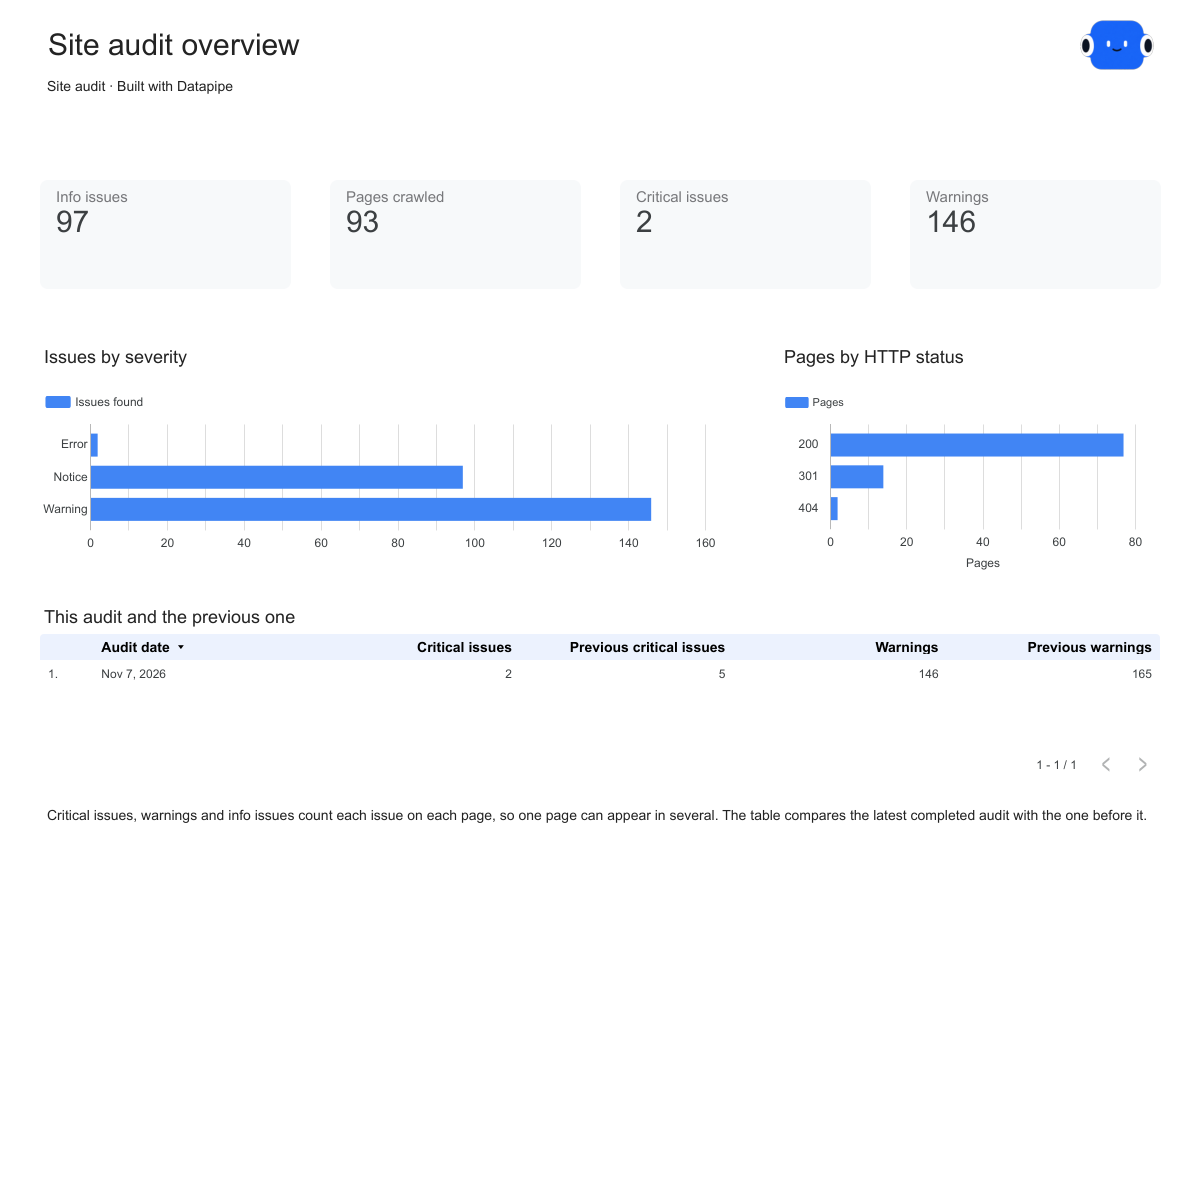
See what is broken. Fix what matters first.

Critical issues, warnings and pages crawled against the previous audit, every issue type with the pages it affects, and the pages with the most issues. One editable report filled from PageOptimized.

A Google account is needed to save a copy.

Explore the report

Choose a page to see its charts and metrics.

Choose a report page to preview
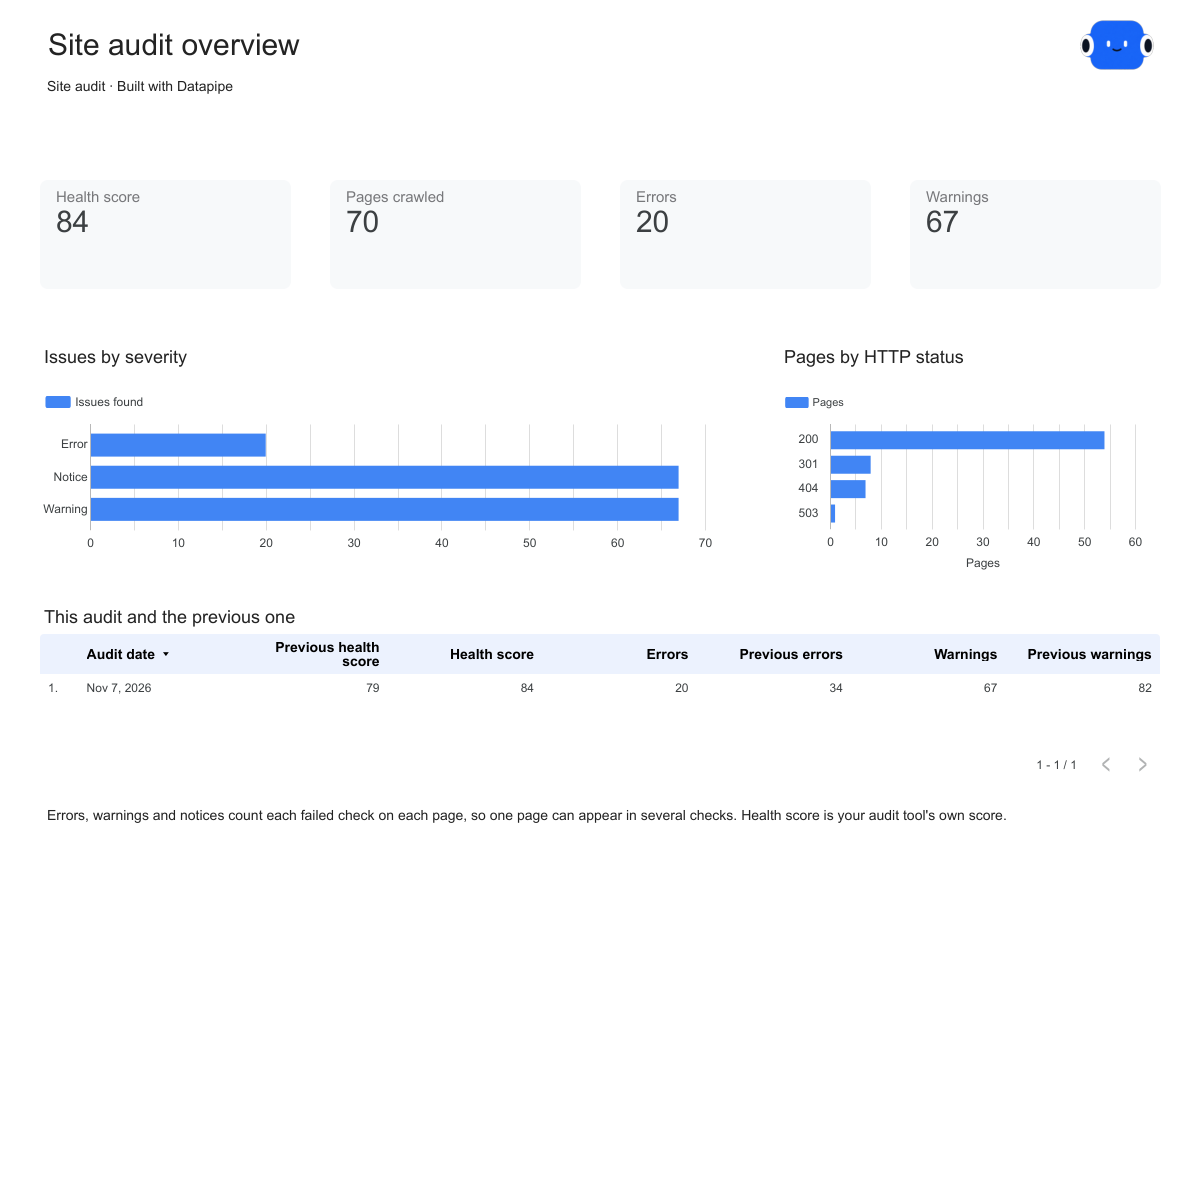
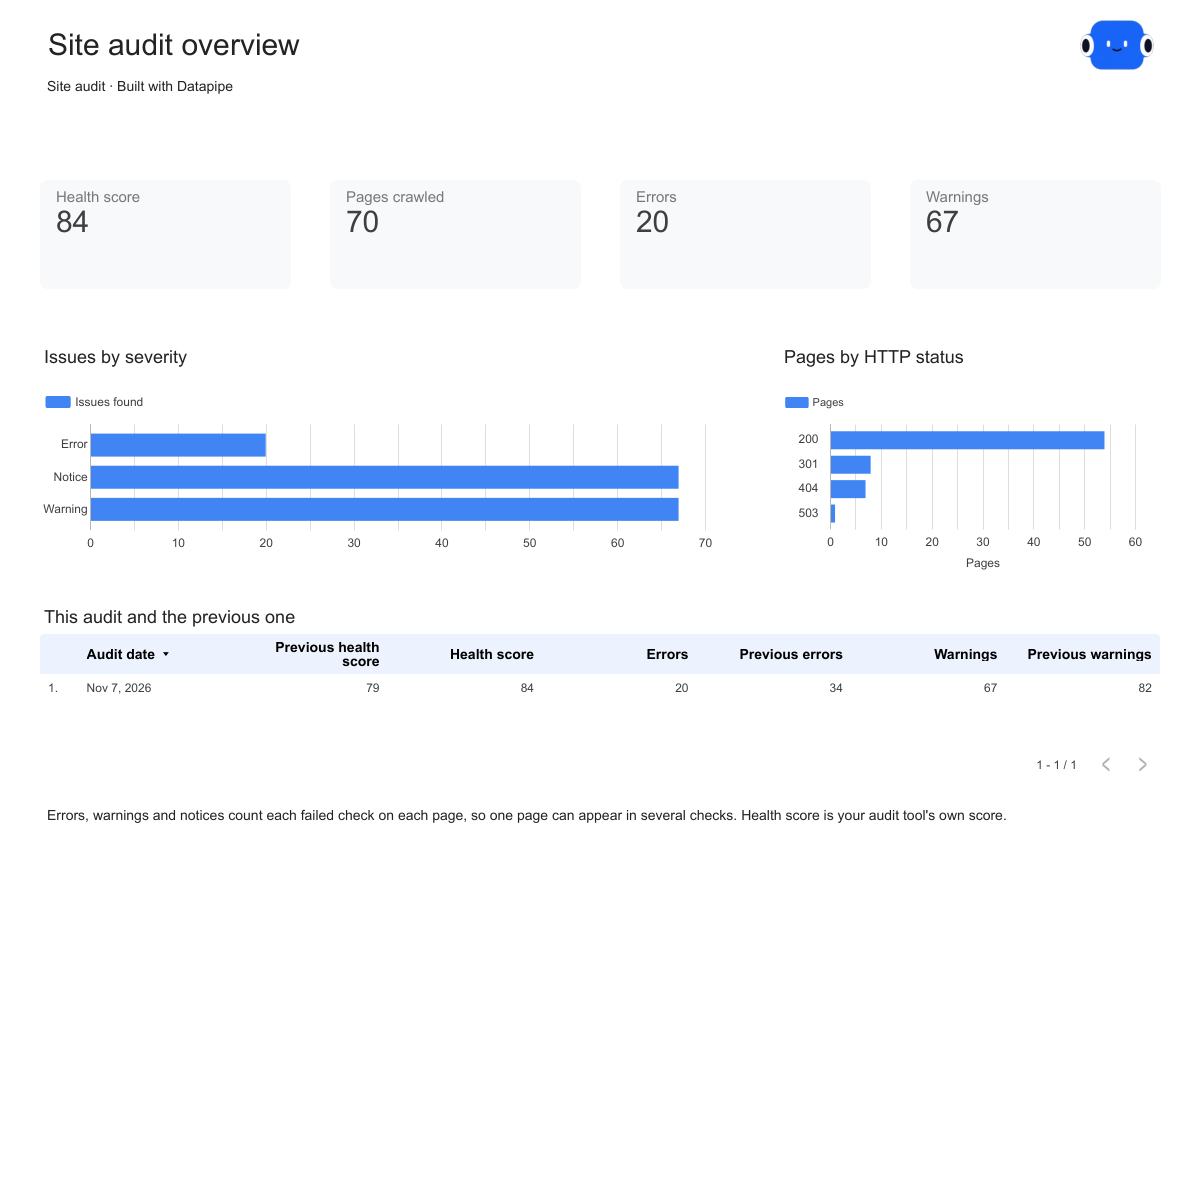
PageOptimized overview report page.
See if the site got healthier. Open this page ↗
PageOptimized issues report page.
Know which fixes reach most pages. Open this page ↗
PageOptimized pages report page.
Find the pages with the most problems. Open this page ↗
PageOptimized start here report page.
Your reporting guide. Open this page ↗

Open interactive report ↗ · Download PDF · CSV

Make this report yours

  1. Preview the report

    Explore the pages, charts and filters.

  2. Save a free copy

    Add your logo and adjust the layout for your team or clients.

  3. Connect your account

    Choose the account you want this dashboard to report on.

Keep your dashboard up to date

Connect PageOptimized. Datapipe updates the Google Sheet behind your dashboard on your schedule.

PageOptimizedSelected account
DatapipePrepare & refresh
Google SheetsPrivate report data
Data StudioYour dashboard

Setup, pricing and metrics

What does this PageOptimized site audit report include?

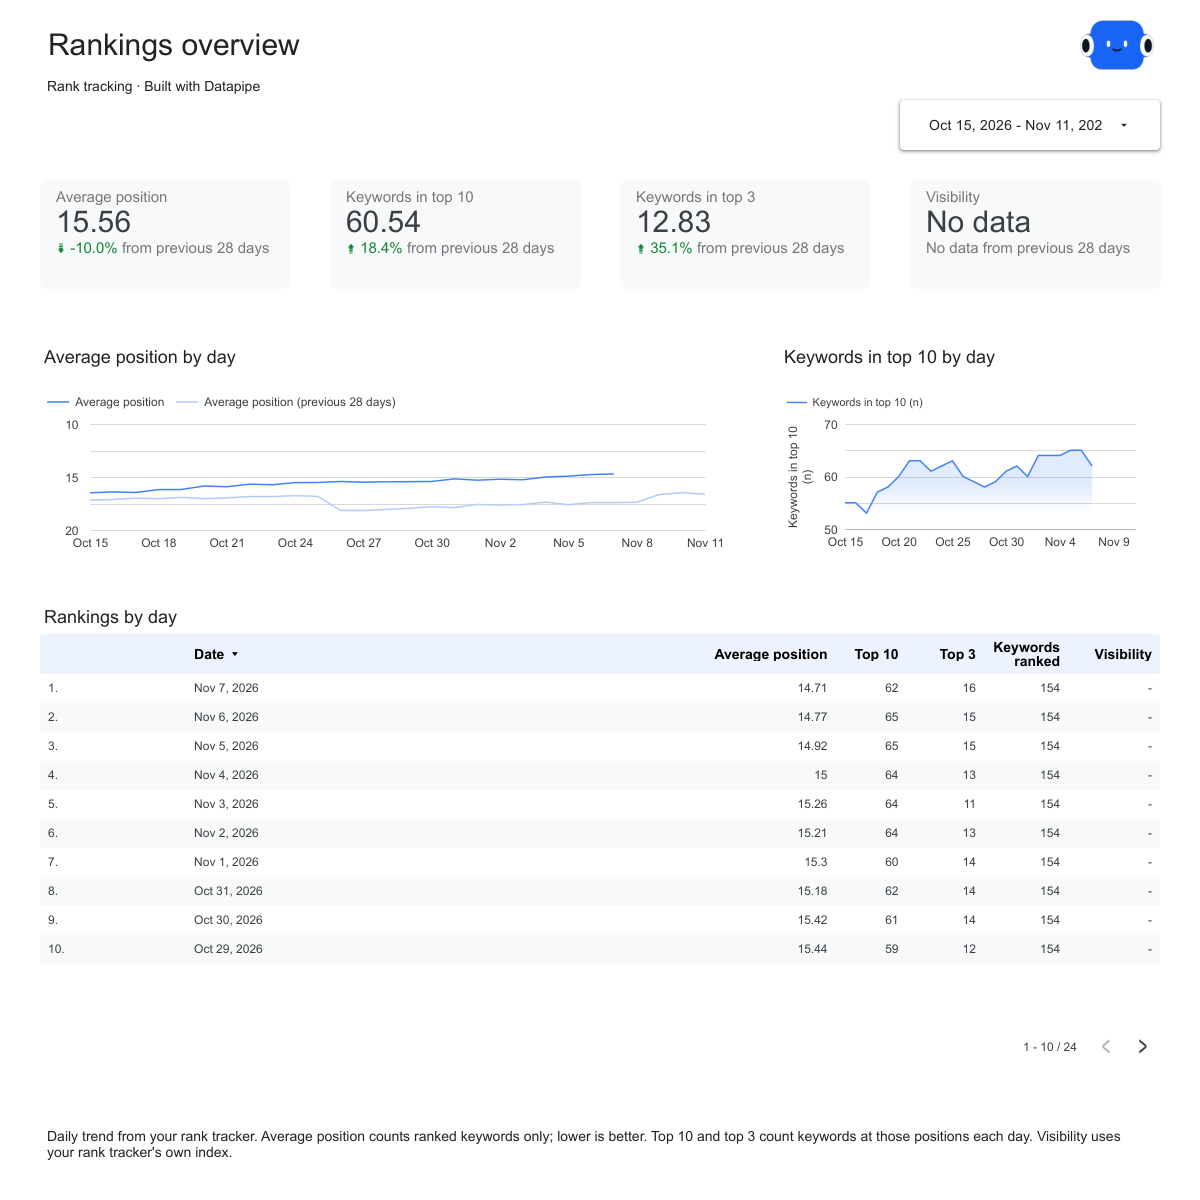
Four pages: Start here, Overview, Issues and Pages. Overview shows pages crawled, critical issues, warnings and info issues with the previous audit beside them. Issues lists every issue type PageOptimized found with its severity and the pages it affects. Pages lists each crawled page with its status, indexability, issues, crawl depth and response time.

How do I use this template with my PageOptimized account?

Add PageOptimized as a data source in Datapipe with your PageOptimized API key, and choose the project if your key covers more than one. Run a site audit in PageOptimized first; Datapipe reads the latest completed audit of your project’s domain and does not start new ones. Then create this dashboard and authorize Google Sheets separately. Datapipe prepares three worksheets (Audit summary, Issues and Pages) and a copy link that replaces all three report sources. Save your private Data Studio report; scheduled exports update the same workbook.

Which numbers come from PageOptimized?

PageOptimized’s latest completed audit of your project’s domain: pages crawled and its critical, warning and info issues, with the previous completed audit of the same site beside them; every issue type with the pages it affects; and every crawled page with its status code, indexability, issue counts, crawl depth, response time, word count and title. Critical, warning and info issues appear as errors, warnings and notices. PageOptimized does not give a health score or count passed checks or incoming links, so those stay empty.

Why don’t issue totals add up to the number of pages?

Each issue is counted once for every page it affects, and one page can have several. The totals describe how much there is to fix, not how many pages have problems. Pages with issues is shown separately on the Pages page.

Is the health score the same in every audit tool?

No. Each tool scores health its own way, so the dashboard keeps the tool’s own score and names it. Tools that do not score health leave it empty. Compare scores from the same tool over time rather than across tools.

Does Datapipe run the audit?

No. Datapipe reads results your tool already has. Run or schedule audits in the tool itself; each refresh picks up the latest results.

Is the report template free?

The template, editable Data Studio copy, PDF and CSV are free. You need a Google account to save a copy. Datapipe plans apply when you connect and refresh your own data.

Make it your next report.