Start free
← All report templates

Salesforce · Free Data Studio template

Salesforce sales pipeline report template
See what each owner won. Know what is still in play.

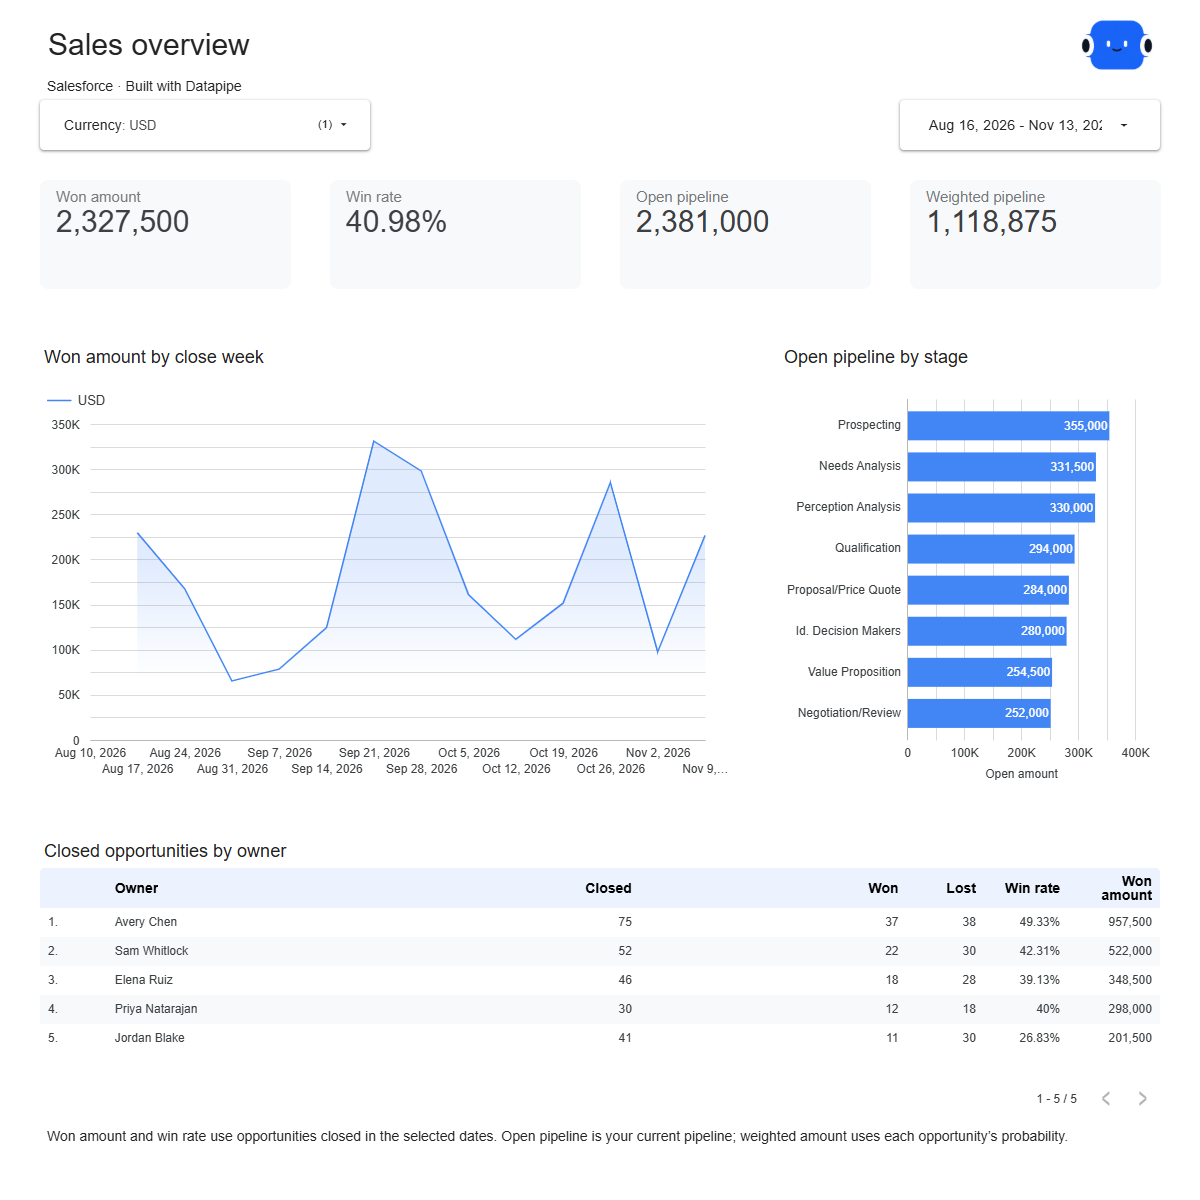
Won amount, win rate and days to close by owner, plus the open pipeline by stage. One editable report for a clearer review of your Salesforce opportunities.

A Google account is needed to save a copy.

Explore the report

Choose a page to see its charts and metrics.

Choose a report page to preview
Salesforce overview report page.
See the sales result first. Open this page ↗
Salesforce won & lost report page.
Understand what closed. Open this page ↗
Salesforce open pipeline report page.
Know what is still in play. Open this page ↗
Salesforce start here report page.
Your reporting guide. Open this page ↗

Open interactive report ↗ · Download PDF · CSV

Make this report yours

  1. Preview the report

    Explore the pages, charts and filters.

  2. Save a free copy

    Add your logo and adjust the layout for your team or clients.

  3. Connect your account

    Choose the account you want this dashboard to report on.

Keep your dashboard up to date

Connect your Salesforce organization. Datapipe updates the Google Sheet behind your dashboard on your schedule.

SalesforceSelected account
DatapipePrepare & refresh
Google SheetsPrivate report data
Data StudioYour dashboard

Setup, pricing and metrics

What does the Salesforce report include?

Four pages covering setup, overview, won and lost opportunities, and the open pipeline. Track won amount, win rate, average won amount and days to close by owner, plus open opportunities by stage, weighted amount and past-due opportunities.

How do I connect Salesforce?

Add Salesforce as a data source in Datapipe and sign in to your organization with its My Domain address; a Salesforce administrator installs the Datapipe app once first. Choose this dashboard, authorize Google Sheets, then save your Data Studio copy. Datapipe refreshes the same workbook on your schedule.

How are win rate and average won amount calculated?

Win rate is won opportunities divided by won and lost opportunities closed in the selected dates. Open opportunities are not part of it. Average won amount is total won amount divided by won opportunities.

What is the weighted amount?

Each open opportunity’s amount multiplied by its probability, as set in Salesforce. Opportunities without an amount still count as open but add nothing to the totals.

Which dates does the report use?

Won and lost opportunities use their close date. Days to close runs from the opportunity’s created date to its close date. The open pipeline is your current pipeline when the data was read; an opportunity is past due when its close date has passed.

Why is the report split by owner instead of pipeline?

Salesforce has no pipelines like other CRMs, so the report groups results by opportunity owner. Stages keep the order set in your Salesforce opportunity stages.

Does the report combine currencies?

No. Amounts stay in each opportunity’s currency and are never converted. Choose a currency with the filter.

Which records are included?

Opportunities the connected Salesforce user can see, with their names, owners, stages, amounts, probabilities, close dates and currencies, plus user names and your opportunity stage settings. The report does not read contacts, accounts, activities or notes.

Is the template free?

The template, PDF and CSV are free. Datapipe plans apply to automatic refreshes from your Salesforce organization.

Make it your next report.