Datapipe
Start free
← All report templates

Microsoft Ads · Free Data Studio template

Microsoft Ads report template
See what your spend brings in. Find the campaigns worth more.

Spend, clicks, conversions and revenue by campaign and network, compared with the previous period. One editable report for a regular Microsoft Advertising review.

A Google account is needed to save a copy.

Explore the report

Choose a page to see its charts and metrics.

Choose a report page to preview
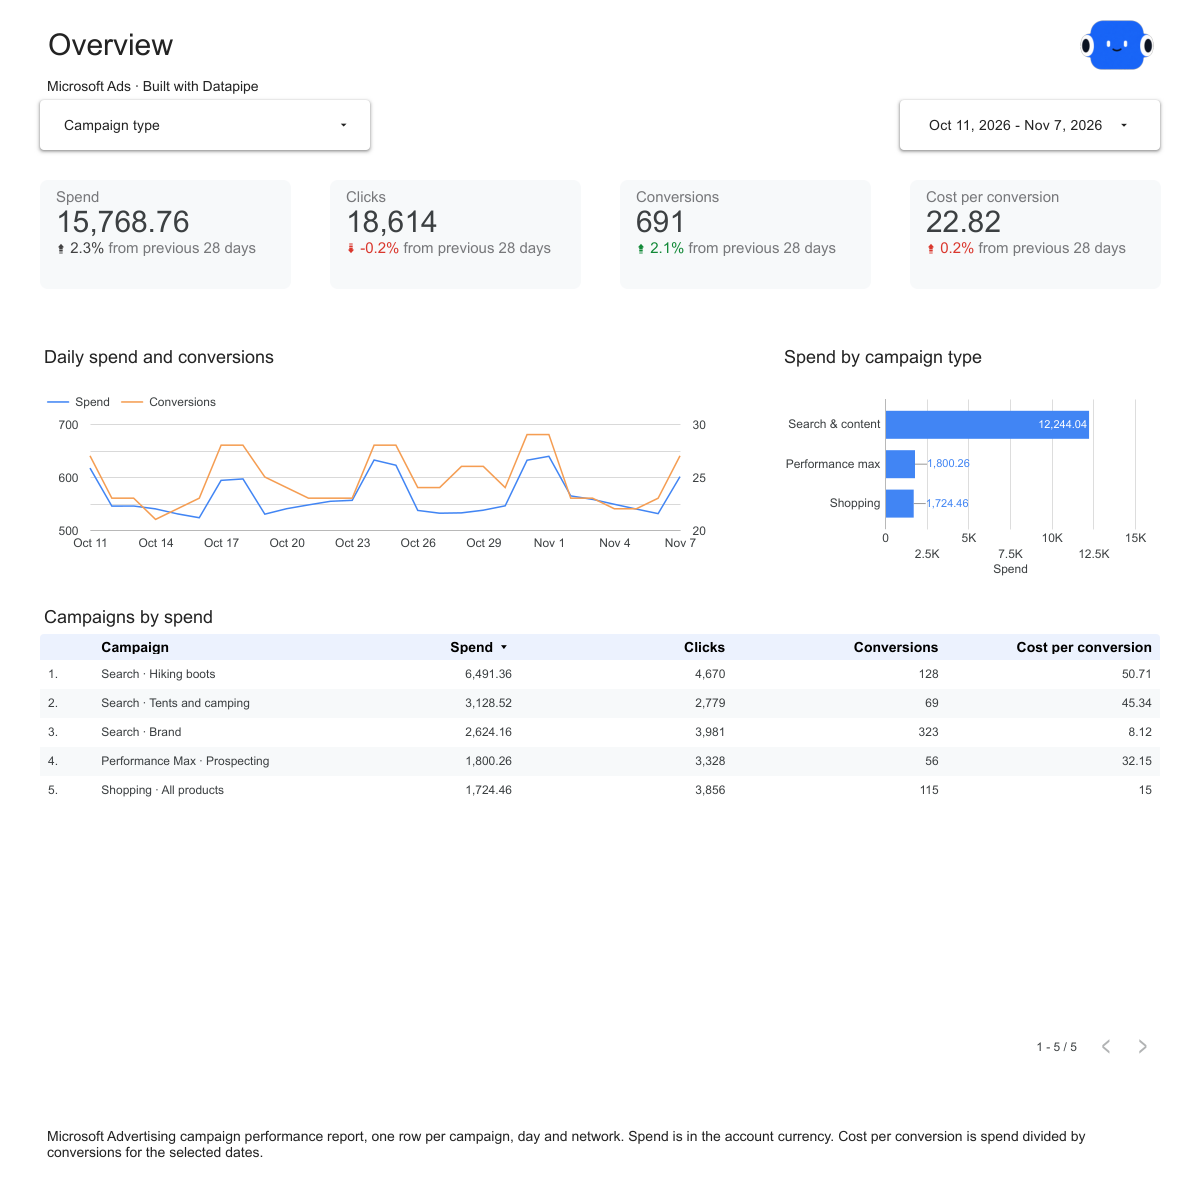
Microsoft Ads overview report page.
See what the account spent and got back. Open this page ↗
Microsoft Ads campaigns report page.
Compare campaign efficiency. Open this page ↗
Microsoft Ads networks and revenue report page.
See where results come from. Open this page ↗
Microsoft Ads start here report page.
Your reporting guide. Open this page ↗

Open interactive report ↗ · Download PDF · CSV

Make this report yours

  1. Preview the report

    Explore the pages, charts and filters.

  2. Save a free copy

    Add your logo and adjust the layout for your team or clients.

  3. Connect your account

    Choose the account you want this dashboard to report on.

Keep your dashboard up to date

Connect your Microsoft Ads account. Datapipe updates the Google Sheet behind your dashboard on your schedule.

Microsoft AdsSelected account
DatapipePrepare & refresh
Google SheetsPrivate report data
Data StudioYour dashboard

Setup, pricing and metrics

What does this Microsoft Ads report include?

Four pages: Start here, Overview, Campaigns, and Networks and revenue. Overview compares spend, clicks, conversions and cost per conversion with the previous period. Campaigns shows CTR, average CPC and conversion rate for each campaign. Networks and revenue shows revenue, ROAS and results by network.

How do I use this template with my own account?

Add Microsoft Ads as a data source in Datapipe, sign in with Microsoft and choose the ad account, then create this dashboard. Authorize Google Sheets separately. Datapipe prepares the worksheet and a copy link that replaces the report source. Save your private Data Studio report; scheduled exports update the same workbook.

Which Microsoft Advertising report does it use?

The campaign performance report from the Microsoft Advertising Reporting API, aggregated daily, with one row per campaign, day and network. Days a campaign had no activity are left out, as Microsoft leaves them out.

How are cost per conversion, CTR and ROAS calculated?

Cost per conversion is total spend divided by total conversions. CTR is total clicks divided by total impressions. ROAS is total revenue divided by total spend. All are calculated from the totals for the selected dates, not averaged across rows.

Why is revenue empty?

Revenue appears only when your conversion goals report a revenue value. Without it, revenue and ROAS show no data; spend, clicks and conversions still fill the report.

How much history does the dashboard read?

Up to the last 90 days of complete days by default, and up to 366 days. The dashboard opens on the last 28 days, ending yesterday, compared with the 28 days before that. Amounts stay in the account currency.

Is the report template free?

The template, editable Data Studio copy, PDF and CSV are free. You need a Google account to save a copy. Datapipe plans apply when you connect and refresh your own data.

Make it your next report.